The results were presented live by Enrico Durbano, Eco-Counter’s General Manager at the "Cycling tourism, slower can get us further!" session.

Please find below the main conclusions of this session:
2023 EuroVelo Barometer results
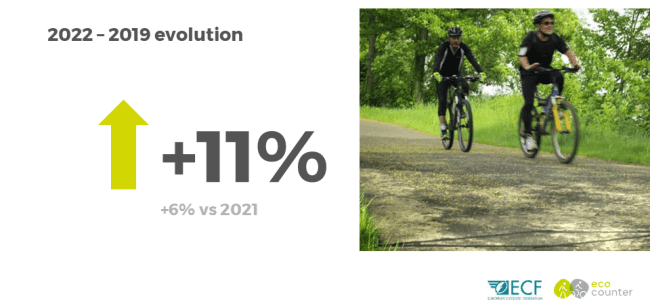
Between 2019 and 2022, cycling on European EuroVelo cycle routes increased by 11%. The increase is 6% compared to 2021.
Comparison of monthly bicycle traffic on the EuroVelo network between 2022 and 2019

A closer analysis of monthly bicycle traffic shows which months are the most favorable for cycling, and which explain the increase in bicycle traffic between 2022 and 2019. We note here that March, May, October and November record more traffic in 2022, showing a growing use of the EuroVelo network before and after the tourist season.
Weekday and weekend bicycle traffic on the routes
An analysis of weekday and weekend traffic reveals other trends: the increase is greater on weekends than on weekdays, but the trends remain similar. Comparing 2022 with 2021, the opposite is true: traffic increases more strongly on weekdays than on weekends. This undoubtedly means greater use of EuroVelo routes for commuting purposes, in combination with weekend tourism.
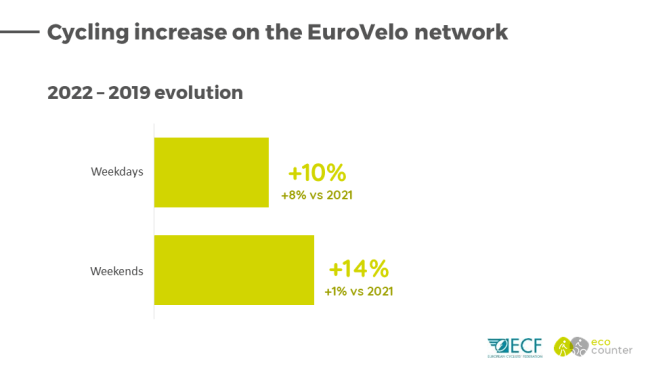
Between 2019 and 2022, bicycle traffic on European EuroVelo cycle routes increased by 10% on weekdays, and 14% on weekends. The increases are 8% and 1% respectively compared with 2021.
EuroVelo routes analysis
Looking at each route for this 3rd EuroVelo Barometer, we can see an increase in traffic on all the routes analyzed (between 2019 and 2022).
The 3 itineraries with the highest increases in bicycle traffic are :
1. EuroVelo 17 "Via Rhona": +35%

2. EuroVelo 8 "Mediterranean cycle route" : +21%

3. EuroVelo 5 "Via Romea (Francigena)" : +16%

Some final thoughts
- Cycling on the EuroVelo cyclo-tourism network has increased significantly in 2022 compared to 2019, both on weekends and weekdays.
- We see an increase on all the routes observed, which differs from previous EuroVelo Barometer results.
- There has also been a slight increase compared with 2021, mainly due to weekday traffic.
This EuroVelo Barometer will be updated annually to present trends, and we look forward to observing the trends for the years to come, not least to understand how bicycle tourism will develop! Additional analyses are regularly available in the EuroVelo newsletter, to which you can subscribe on the ECF website.
You can also download the latest report on ECF website here!
About the Barometer :
- 10 routes analyzed
- 18 countries
- 170 counting sites
- In-depth data validation by our data specialists