Started in 2021, the “DataViz Competition” is co-publicized by Eco-Counter and the League of American Bicyclists on their respective websites and social media. The League of American Bicyclists is a major national bicycle advocacy organization.
The idea of the competition is simple: share with us your existing bike data (whether Eco-Counter data or not) and win a free high-value data service from Eco-Counter (in the form of a custom report, tailored for your needs). Analyses made were also presented during a webinar hosted by the League that you can rewatch on Youtube.
All Bicycle Friendly America program participants, as well as any state or local active mobility advocacy organizations in the US were invited to submit their proposal of data analyses, including goals for count data collection, challenges faced in collecting/analyzing data and equity and diversity considerations.
In last year’s competition (2022), 2 projects were nominated: Lincoln-Lancaster County and Madison/Fitchburg!
After the previous blog post diving into the challenges and results of Lincoln-Lancaster County, here is the one about Madison & Fitchburg!
“DataViz Competition”: and the winner is… Madison Bikes/Bike Fitchburg! [1/2]
When we reviewed the non-profit applications for the DataViz competition, we noticed two organizations were in adjacent cities – Madison and Fitchburg! As a result, we proposed to combine their two datasets to generate a more comprehensive report.
Data sources
It was a great mix of data! Data sources included:
- two different external data providers (namely TRAFx and Centracs)
- data from two Eco-DISPLAYs already installed in Madison to extrapolate counts (you check them on our public webpage!).
- manual counts done by Bike Fitchburg taken at the Velo UnderRound, a bike roundabout connecting Madison to its neighbouring communities.
A special thanks to the City of Madison and the City of Fitchburg for providing access to their permanent count data to support the analysis!
Key results
Because of this regional coordination and cooperation, we were able to use bicycle data (both from automated counters and manual counts) from Madison and Fitchburg and get a better understanding of the larger regional network.
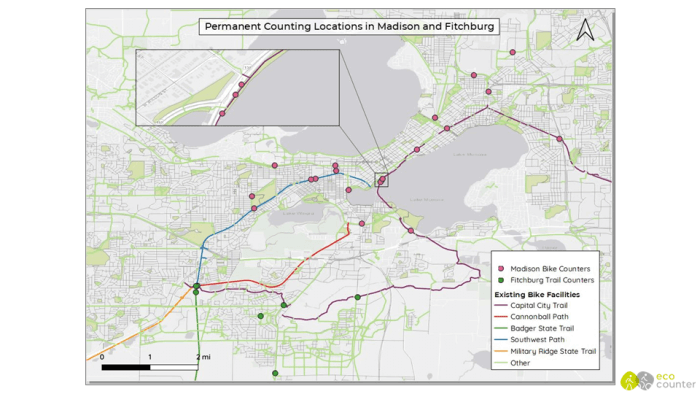
Counters map in Madison/Fitchburg
Average Annual Daily Traffic
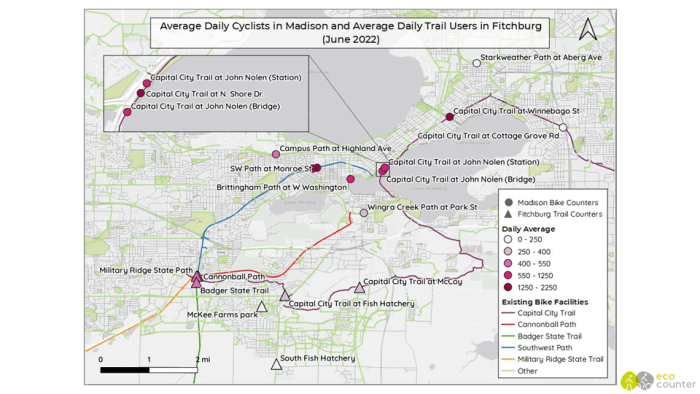
Average Daily Cyclists in Madison and Fitchburg (June 2022)
What is interesting to note here is that bicycle activity is strongest on trails and cycle tracks and tends to grow closer to city Center as well.
The highest counts are located at counting sites in Madison’s downtown and near the university campus.
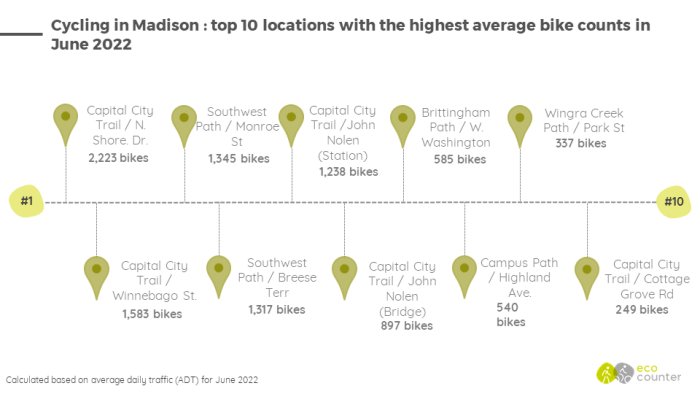
Cycling in Madison: Top 10 locations with the highest average bike counts in June 2022
Organized differently, this is what the top 10 looks like for count locations: capital City Trail / N. Shore Dr. is #1 with an average of 2,223 bicycles counted in June 2022.
It also stands out that the Velo UnderRound is a significant intersection for cycling in both Madison and Fitchburg, we will give more information about this crossroad below.
Specific analysis for the “Velo UnderRound”
Connecting Fitchburg, Madison, Verona, and other nearby locations, the Velo UnderRound is a critical intersection for the region. Through a bike roundabout and a two-level interchange, it links five regional trails – the Southwest Path, Cannonball Trail, Capital City State Trail, Badger State Trail and Military Ridge Trail.
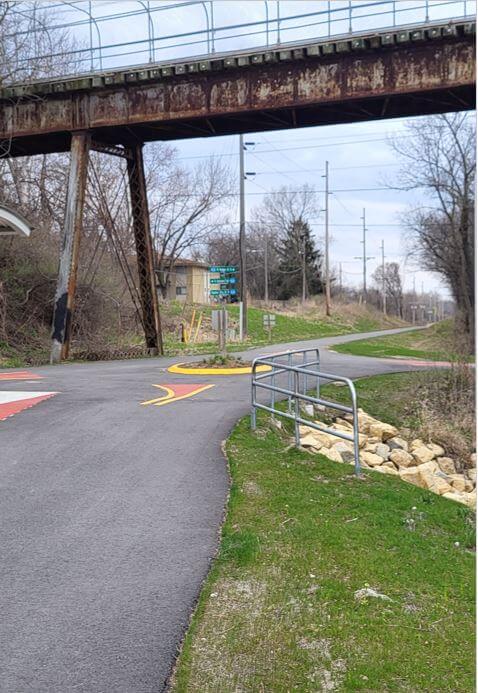
The “Velo UnderRound”, connecting multiple trails in Madison & Fitchburg. Picture credit: Bike Fitchburg
By extrapolating Bike Fitchburg’s manual counts, we estimated the average annual daily bikes to be 479 bikes in 2018-2019 and 669 bikes in 2022. Using the 2-hour AM manual counts taken on a yearly basis, we were able to analyze the distribution of cyclists for each roundabout segment. It highlights that most users during the morning commuting hours are riding on the Southwest Path (39%) and the Military Ridge State Trail (25%).
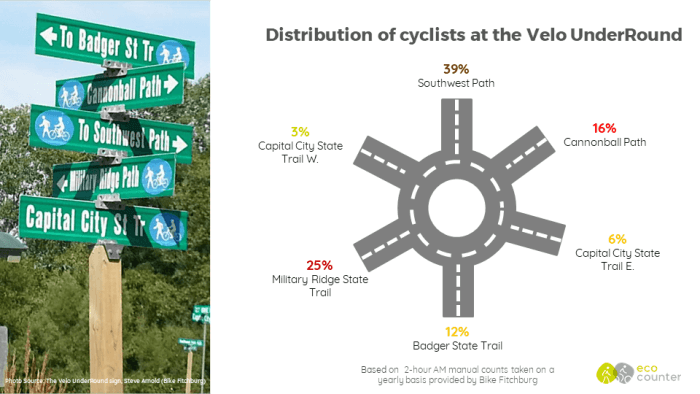
Distribution of cyclists at the Velo UnderRound
Exploring the impact of the pandemic
When we analyze the average bicycle traffic during weekends in Madison across multiple years, a similar pattern begins to emerge: after the bike boom of 2020, bicycle traffic levels returned to pre-pandemic in 2022 (with 2021 being sort of “in-between” these two trends).
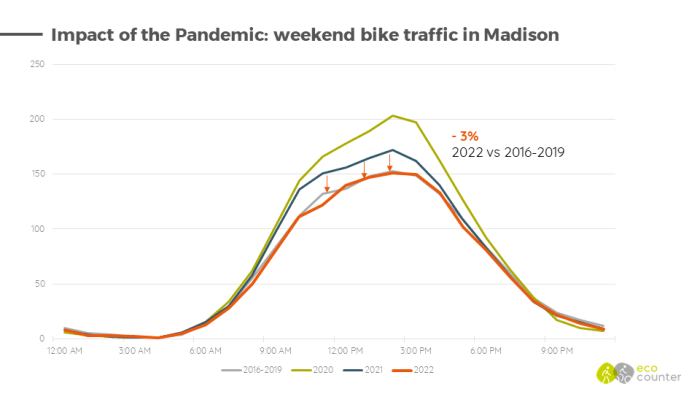
Impact of the Pandemic: weekend bike traffic in Madison
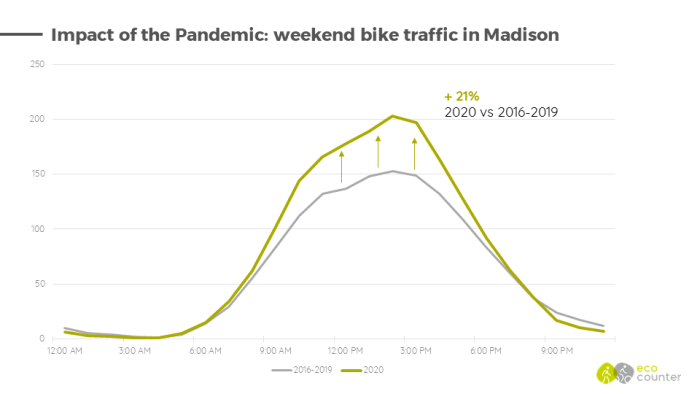
Impact of the Pandemic: weekend bike traffic in Madison
2022 is indeed the first year we saw a decrease in average bike traffic counts in Madison since the beginning of the pandemic (-3%). Of course, this trend has been seen elsewhere and is not unique to Madison. Overall, this decrease is very minimal, however it points to a return to similar weekend patterns from pre-pandemic times.
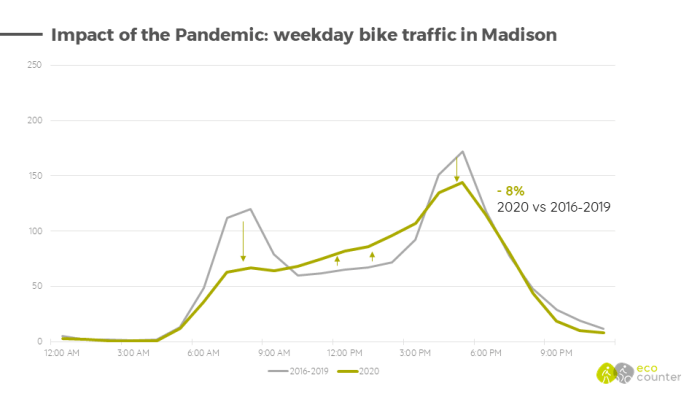
Impact of the Pandemic: weekday bike traffic in Madison (2020)
For weekday traffic, the story is a bit different: in 2020, what we saw was a decrease of traffic during the morning and afternoon peaks, and an increase in the rest of the day, due to the implemented sanitary restrictions and work-from-home policies.
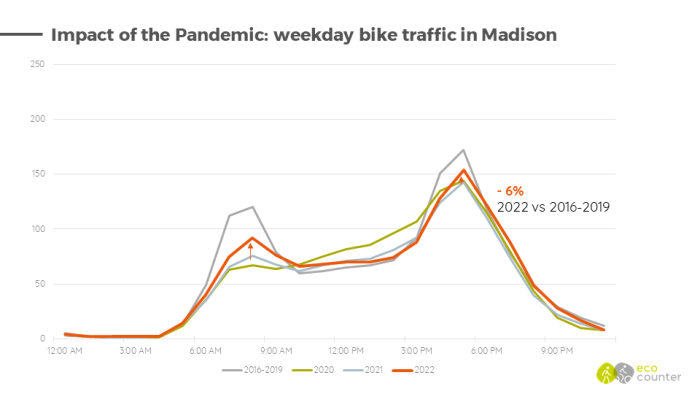
Impact of the Pandemic: weekday bike traffic in Madison (2022)
In 2022, these trends seem to fade away, as we gradually return to 2019 hourly profiles (but not entirely yet!). Overall, it is interesting to note that bicycle traffic for weekdays in 2022 is down 6% vs 2019.
It seems that current bicycle traffic for weekends and weekdays is stagnating compared to 2019. To some extent, it is also the trend we are seeing on a national level in the US through our Eco-Counter Index, where bicycle traffic only increased by 4% between 2019 and 2022 in the US.
Key takeaways
A poster was created to summarize the key takeaways for Madison & Fitchburg:

With some of the highest overall counts, Capital City Trail and Southwest Path are important cycling axes connecting Madison and Fitchburg.
The pandemic had a dramatic impact on cycling, increasing bike counts on weekends and reducing them on weekday commuting hours. Cycling commuting patterns are making a gradual return to Madison and Fitchburg, and that also means 2022 bicycle traffic volumes are returning to those observed in 2019.
About our Data Services
At Eco-Counter, we are committed to providing high-quality data expertise services that are tailored to your specific needs. Whether you need specific reports, validation and data reconstruction, or estimation of annual or seasonal volumes from short-term counts, we can help.
Beyond our physical products, we offer a wide range of services that can help you gain insights into your data.
Here is how we can help:
- Our validation and data reconstruction services ensure that your data is accurate and reliable, so you can trust the results. Using a proven and reliable methodology, we validate, reconstruct data if needed, and communicate the results with you in full transparency.
- We can also create specific reports to provide detailed analysis of your data, giving you the information you need to make good decisions.
- In addition, we can also help you estimate annual or seasonal volumes from short-term counts. This is a valuable method for getting a better understanding of your network with less resources.
Contact us today to learn more about how we can help you make sense of your data!


There is no comments