The growing need for e-scooter counting to analyze trends and uses between bicycles and micromobility
There has been a major evolution in the field of micro-mobility: more electric scooters were sold in 2019 than electric bikes and vehicles. This new mode of travel has therefore naturally and rapidly taken over urban space, generating mixed political and media comments about this new use. Electric scooters are gaining legal place on the road and on bicycle facilities. These new developments reinforce the need to measure both the number of users who have chosen this mode of travel (and trends), and the speed of users.
To meet this need, Eco-Counter has recently developed a new technology: the ZELT Evo. This new generation of counting systems allows for improved detection and classification of several types of users: bicycles, of course, but also personal mobility devices (PMDs) such as e-scooters.
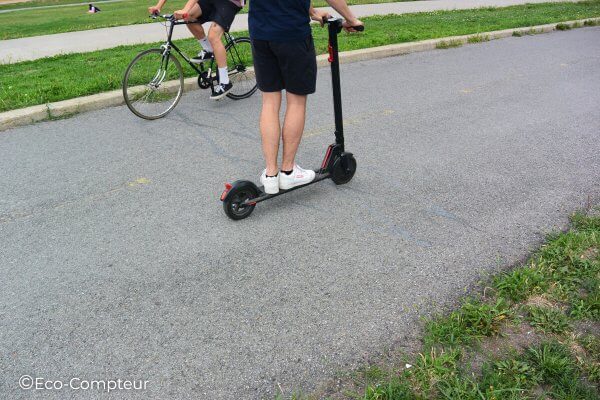
ZELT Evo counter allowing for bicycle and e-scooter counting
This new technology is based on the expertise developed by Eco-Counter over the last 20 years around the induction loop technology, which detects metallic objects that disturb an electromagnetic field. Initially designed to count bicycles (excluding all other modes), Eco-Counter’s development of the new Evo digital sensor now allows for a more accurate detection of other users, including scooters associated with a specific signal.
Among the first cities equipped with this new counter is Lyon Metropolis in France.
History of permanent counting in Lyon
For more than 10 years, Lyon Metropolis has been carrying out manual and automatic counts to monitor the evolution of bicycle traffic in Lyon and the surrounding municipalities. The Metropolis has gradually equipped itself with automatic counting systems and now has a vast network of 71 automatic counters.
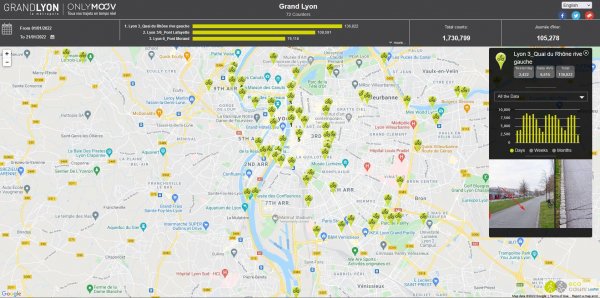
Implementation of automatic counting systems in Lyon
Public data are available here.
A complete and comprehensive analysis of this data has highlighted a trend: the strong increase in bicycle traffic, which has reached +15% per year for the past 6 years, i.e. +370% in 10 years. This increase is linked with proactive political actions taken by the Metropolis to develop bicycle infrastructure and services since 1998.
An analysis of the average daily traffic on various strategic routes shows that cyclists very often represent a quarter to a third of the total traffic on major routes with bicycle facilities:
Berges du Rhône: 8,000 bicycles/d: 31% of total traffic
Cours Gambetta: 6,100 bicycles/d: 32% of total traffic
Pont Morand: 5,500 bicycles/d: 29% of total traffic
Pont Lafayette: 5,400 bicycles/d: 25% of overall traffic
Rue de la Part-Dieu: 4,500 bicycles/d: 72% of overall traffic
Integration of micromobility data
Of the 71 counting sites in Lyon, 11 are now equipped with the new ZELT Evo counter, and have been collecting data on the use of scooters since September 2021.
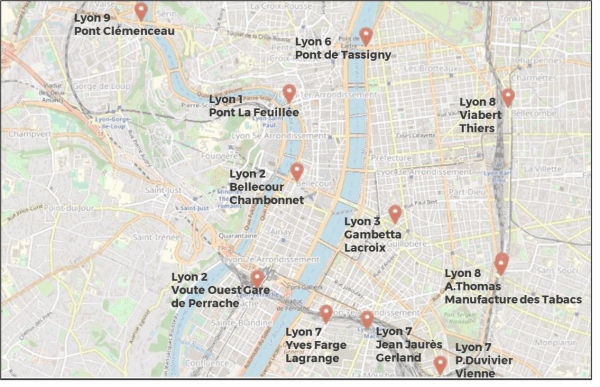
Counting sites location for bicycle & e-scooter data
By analyzing the September-October 2021 ridership data, we can understand the ridership trends in bicycle and scooter use.
In terms of volume, we see that bicycle ridership is on average higher than scooter ridership by a factor of 3.23 on weekdays, and 2.74 on weekends.
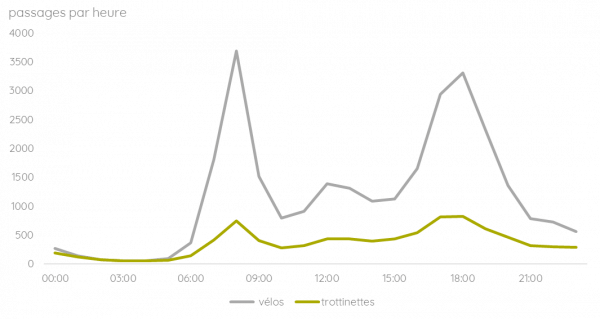
Hourly profile of bicycle/scooter use on weekdays, by volume
On weekdays, the peak hours in the morning, at noon and in the evening are very strong for bicycle users, and slightly more diffuse for scooter users.
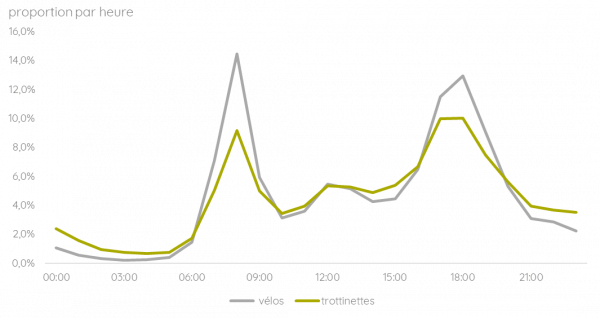
Hourly profile of weekday bicycle/scooter use, percentage of total
As a proportion of the total, this trend is even more pronounced, and we observe a greater use of scooters in the evening (after 8 p.m.).
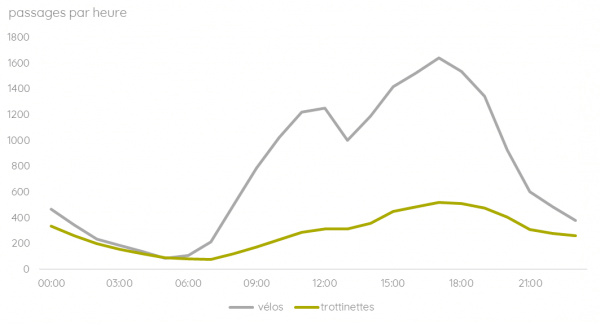
Hourly pattern of bicycle/scooter use on weekends, by volume
On weekends, the trends remain similar between bicycle and scooter traffic, although here again bicycle traffic is higher than scooter traffic by a factor of 3.
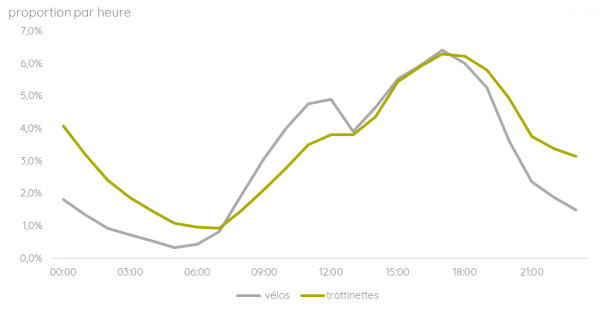
Hourly pattern of bicycle/scooter traffic on weekends, as a percentage of total
As a proportion of the total, there is also a higher use of scooters in the evening, and an under-use (compared to bicycle use) earlier in the day.
Learn more about our bicycle/scooter counting system
Combining count data with external data sources
To further analyze the data, we cross-referenced automatic counters data with data from Blue Systems, a data aggregator for self-service PMDs.
Each counting site location has been associated with one or more GPS sections, and then the data were associated to check their correlation.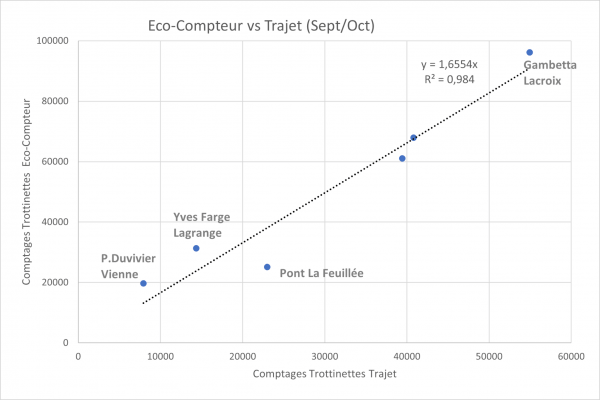
Correlation of Eco-Counter data vs. Blue Systems data
The results show a strong correlation between the two data sets, which allowed to obtain an estimate of the split between self-service and personal scooters, with an estimated distribution of 50% personal vehicles and 50% self-service PMDs.
In the long term, these data correlations will make it possible to obtain a complete map of the use of scooters on the entire network. Count data can indeed be used to calibrate the GPS traces and correct data biases from self-service EDPM operators.

Analysis example carried out for the city of Nantes, combining count data and GPS traces
NB: data presented in this article are the property of Lyon Metropolis. We would like to thank Pierre Soulard, Head of the Urban Mobility Roads Department for Lyon Metropolis, for the authorization to distribute them.


There is no comments