What do you get when thousands of people pedal into action for a day of swapping their car keys for bike helmets? You get Bike Anywhere Day.
Organized by the San Diego Association of Governments (SANDAG), this annual event encourages people to replace their car trips—to work, to school, to grocery stores, you name it—with bike trips. This year, it happened on Thursday May 16, 2024.

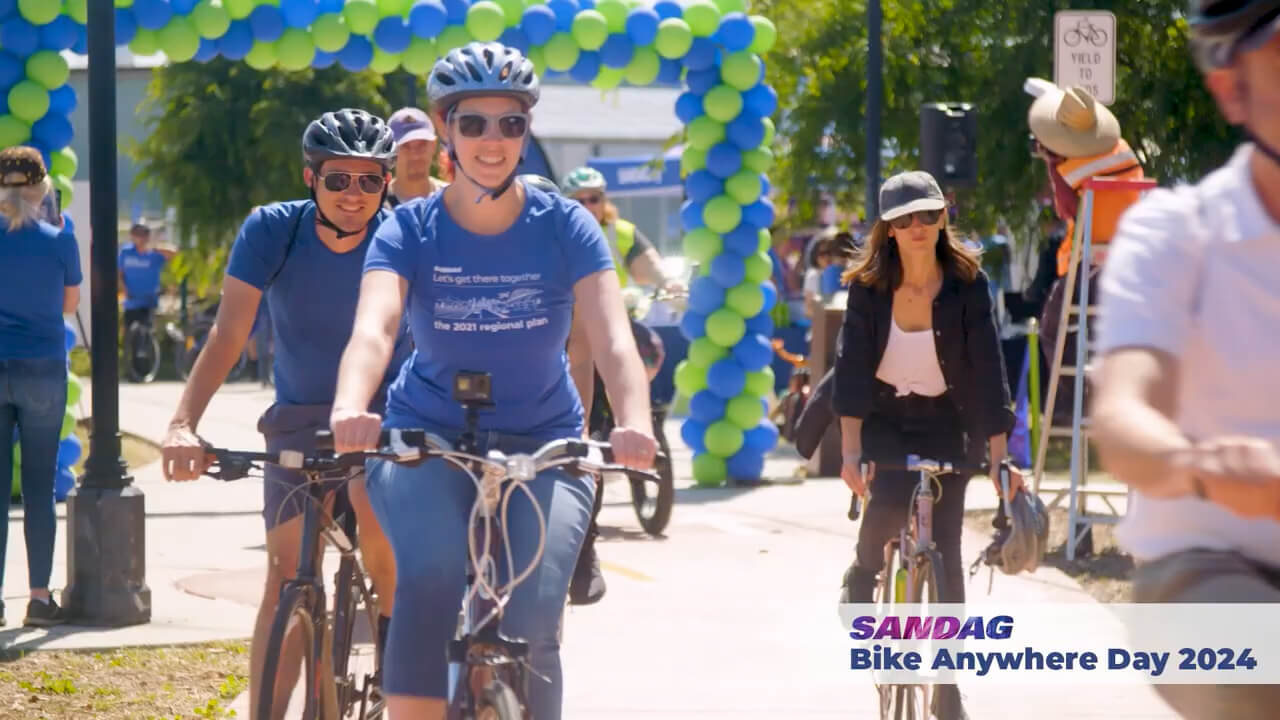
A still from SANDAG’s promotional video for Bike Anywhere Day 2024. Photo credit: SANDAG
Historically, tremendous effort is put into this event, and this year was no different. Over 100 businesses, non-profits, and schools hosted pit stops with music, food, and swag for cyclists across the region. The overall goal? To support cycling and to make everyone feel safer biking within the community.
CHALLENGE
With so many resources invested in the event, SANDAG naturally began asking if they could call it a success. They had volunteers counting the cyclists visiting each pit stop but wanted deeper insights. Specifically, they wanted to know two things:
- How much did ridership levels change compared to a typical day?
- Did ridership levels sustain after the event?
METHODOLOGY
To provide SANDAG with the knowledge they were looking for, two resources were essential. Number one was historical data from bike counters that had already been counting for many years. Number two was new data from short-term counters installed specifically for the event.

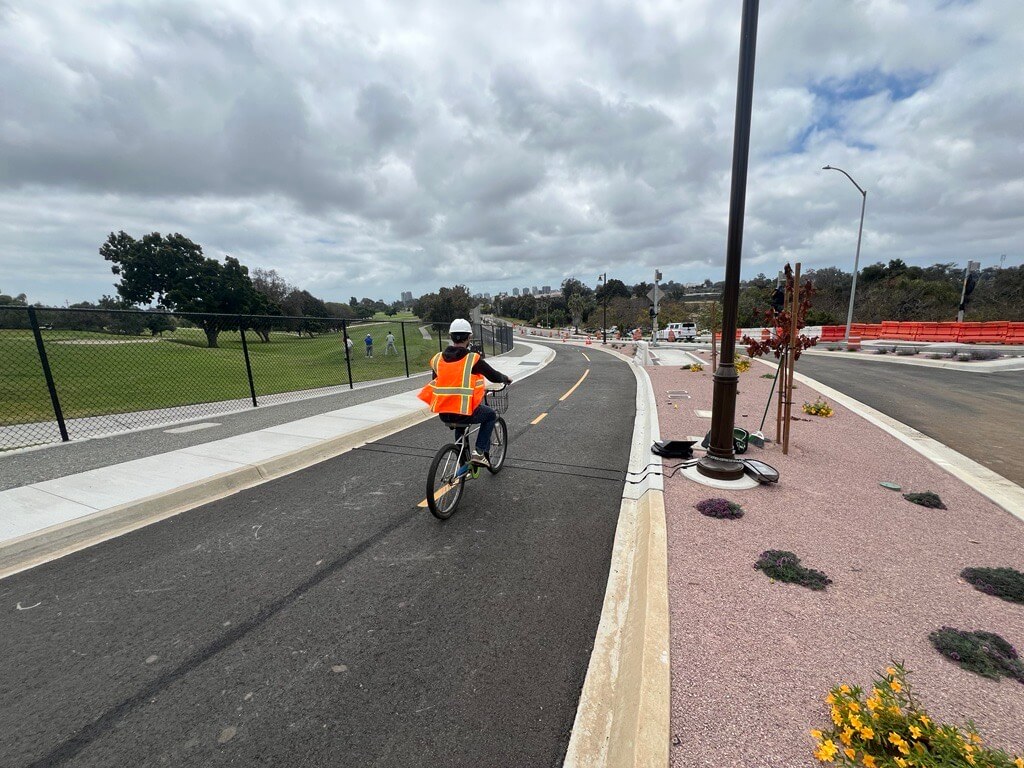
Josh from SANDAG testing a newly installed short-term bike counter.
So, we took data from 2023-2024 from permanent counters installed on bike facilities across San Diego County. Then, we installed two temporary tube counters at mutually decided key destinations from April 26 to June 7, 2024. Finally, as a supplement, we also referenced the counts collected by the over 100 pit stops hosted throughout the County.
Combining these data sources, we had what we needed to conduct a more complex study for SANDAG.
OBSERVATIONS
Did Ridership Increase on Bike Anywhere Day?
First off, SANDAG was able to gather a great data figure thanks to their volunteers. In 2024, visits to pit stops went from 7500 in 2023 to 9000—an increase of over 20%.
While this was great news, SANDAG asked a smart follow-up question. Did the event create an increase in ridership compared to a typical Thursday? After all, without understanding the typical behavior of cyclists, it would be hard to see the extent their event made an impact.
Using the data we collected, we found an answer. In 2024, Bike Anywhere Day had an estimated 40% ridership increase on utilitarian sites in the region compared to similar days throughout the year. In our analysis, we compared the event day with other Thursdays in the summer months of both 2023 and 2024, with similar temperatures and weather conditions. (On Bike Anywhere Day 2023, there was a stunningly similar 39% ridership increase, showing off this event’s superb consistency.)
Comparison of Bike Anywhere Day vs. the previous Thursday. Bike Anywhere Day had a notable increase in volume.
If we dive deeper, the ridership increase becomes even greater in some places.

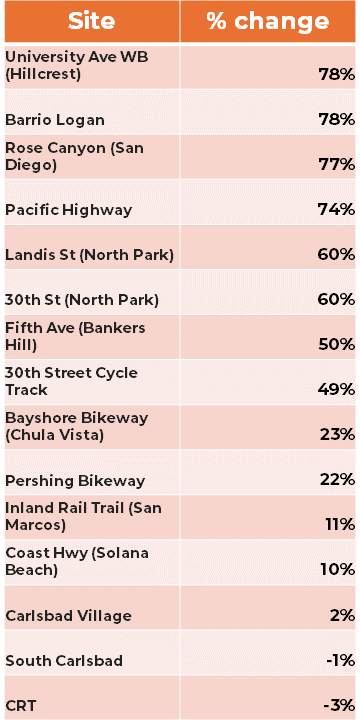
Count sites and their respective change in bike volumes on Bike Anywhere Day compared to average of the surrounding Thursdays.
On Bike Anywhere Day, the busiest sites in San Diego County saw increases of 78% in bike volumes compared to neighboring Thursdays. On the other hand, the bottom three sites saw almost no change. We believed these sites were outliers, with their low volumes possibly attributed to a lack of pit stops in the area.
Also worth noting: Barrio Logan and Pershing Bikeway were temporary counter sites. Without these short-term installations, key data would have been overlooked!
Did Ridership Continue after Bike Anywhere Day?
In short, the answer was yes and no.
On the weekend after Bike Anywhere Day, there was a 37% increase in ridership on recreational sites compared to other weekends. However, the following week and weekend saw no statistically significant change from typical ridership across any site type.
Comparison of the Thursday following Bike Anywhere Day vs. the Thursday before Bike Anywhere Day. No significant change in bike volumes was recorded.
The reason for this “return to the status quo” could be due to many factors, such as infrastructure availability, lack of other cyclists on the road, or simply snapping back into old routines.
Though more research is needed to come to any solid conclusions, this study does show one thing quite clearly: that is, that there is a willingness among the population to bike more and that there is demand for more bicycle infrastructure and bike events.
More Insights – Holidays and Weather Effects?
Using the data we collected, we extracted two additional insights.
First, we saw that national holidays increased bike counts by a whopping 44-53% on recreational sites in the region. We concluded this by analyzing the permanent bike counts on all the holidays in 2023 and 2024 such as New Year’s Day, Christmas, and Thanksgiving.
Second, we discovered that 66 degrees Fahrenheit (19 degrees Celsius) was the tipping point for cycling in the region. Meaning, whenever it falls below that temperature, ridership also falls significantly in correlation.
CONCLUSIONS
After conducting our study, we believe that Bike Anywhere Day is a successful marketing event that will continue to grow with each iteration. This year, ridership rose 40% compared to an average Thursday. Moreover, pit stop counts rose 20%, with a total of over 9000 cyclists counted.
That said, ridership levels returned to normal the week after the event. Nonetheless, this study highlights the potential of improving cycling infrastructure in the San Diego Region. There are many potential cyclists in the area, but it make take other factors like infrastructure and cultural shift to keep them pedaling in the long term.

Cyclists along San Diego Bay, California. Photo credit: CYSUN
Beyond this, we came to a few more conclusions while conducting our study:
- Counters can be used to measure the success of events and marketing initiatives, not just infrastructure improvements. This includes seeing which locations ridership increases most to inform strategy for future events.
- Long-term counters with historical data were the only reason this study was possible and are key to gauging trends in local bike activity. We suggest that having extra data is better than no data, as you might not predict all the future uses of your data down the line.
- Count data pairs excellently with several data sources, like the pit stop counts. Combining data from different sources can give deep regional insights.
- Short-term counters quickly capture site-specific data, but are best used when extrapolated with permanent counters. Short-term counters also help identify where permanent counters may be a worthwhile investment.
All in all, we can’t wait to see how many cyclists participate in next year’s Bike Anywhere Day!
Explore the counters we used for this study here.
Want to know more about this study? Reach out to our data team via our contact us page.


There is no comments