


Managing the visitor experience at Acadia National Park, USA
Acadia National Park is one of the most popular national parks in the United States, and the only one in Maine. Its many miles of trails, mountains and coastline is open year-round to national and international visitors.
Despite its high visitation (4 million estimated visits per year), Acadia is one of the smallest national parks in the United States – ranking 50th out of 63 by size. This makes the visitor experience a major concern for park managers.

Sunset on Cadillac Mountain in Acadia National Park / Photo by Sam Mallon/Friends of Acadia
Naturally, Acadia’s park managers have many questions about their park: How many people visit? Where do they go? What useful information can they collect for preservation projects?
Acadia’s managers use a variety of data sources to help improve the visitor experience. One example is at the highest peak in the park (and the highest point on the US East Coast): Cadillac Mountain. With an altitude of 1528 ft (466 m), this site is very attractive for hiking enthusiasts because of its breathtaking sunsets.
However, in recent years, crowding on the summit has become a concern. On peak days, heavy vehicle traffic would occupy the road leading up to the summit parking lot. Due to this congestion, emergency vehicles could not access the summit at certain times of the day.
To optimize the visitor experience, improve safety, and better manage motorized vehicles, Acadia introduced a time slot based vehicle reservation system. Without a reservation, visitors could not drive up to the summit. At the same time, Acadia saw this as an opportunity to encourage eco-friendly transportation options and reduce the park’s environmental impact.
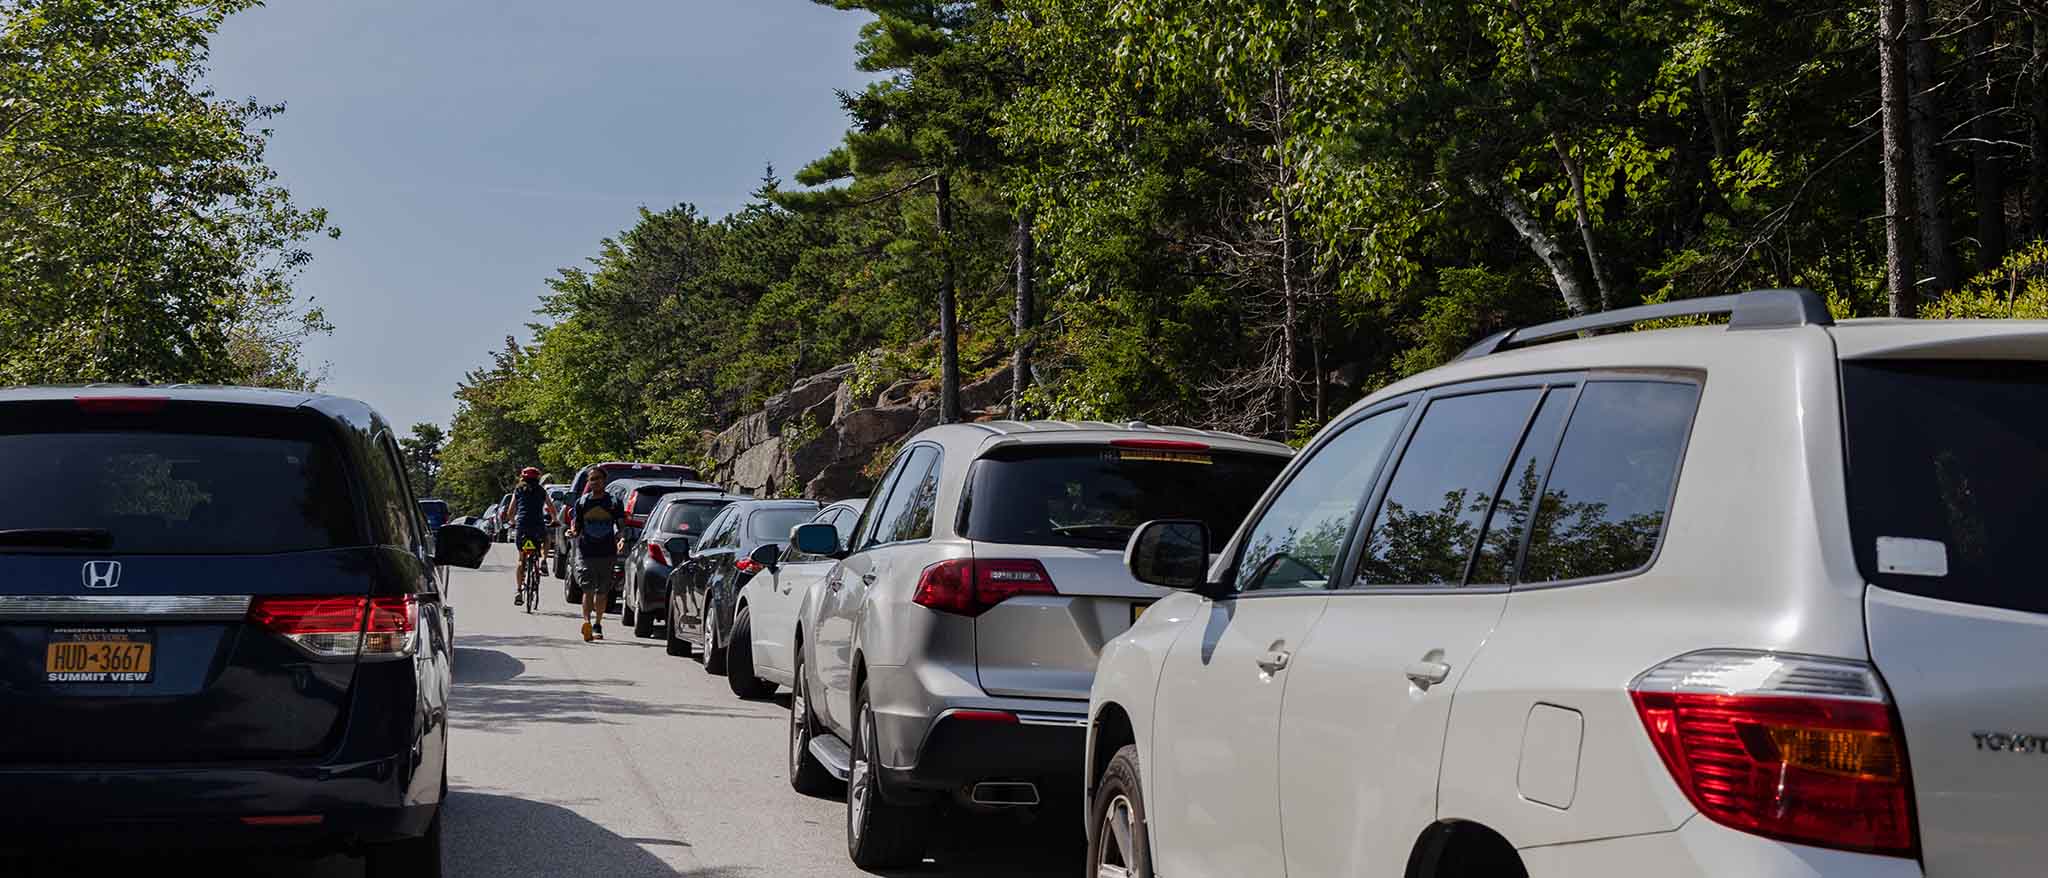
Heavy traffic congestion on Park Loop Road near Sand Beach in Acadia National Park. (Photo by Sam Mallon/Friends of Acadia)
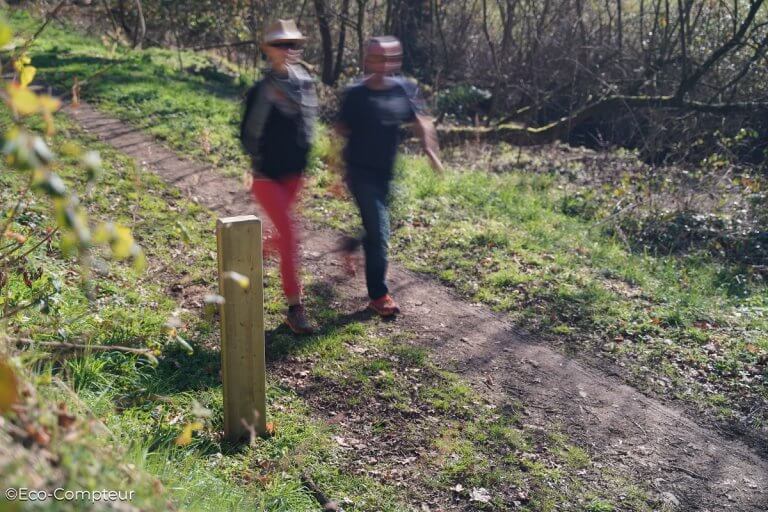
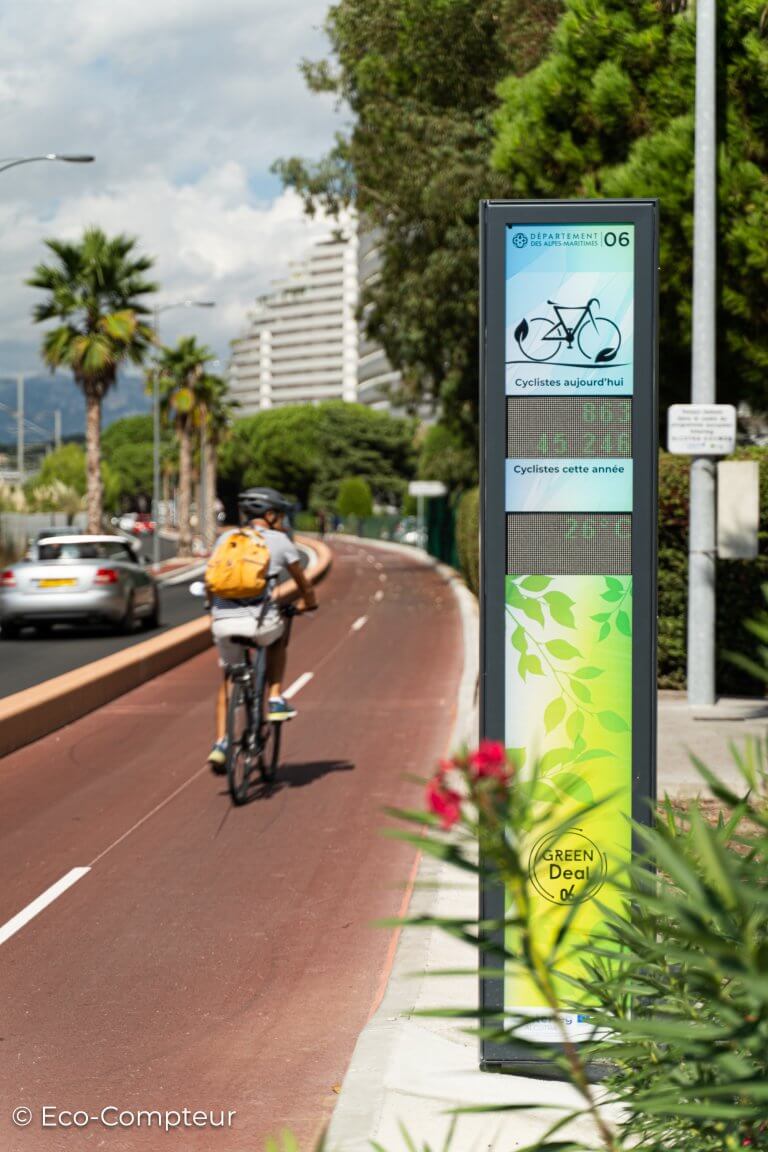
Hence, they gave free access to visitors walking or cycling to the summit. But, how would they measure the impact of this decision? With counters, of course!

They started by placing counters at key points on the trail up to the summit that were only accessible by cyclists and pedestrians. From there, Acadia could get round-the-clock counts and see the proportion of visitors choosing these modes. Then, they could track the trend over time and quantify the impact. For example, Acadia guessed that more people would choose to walk or bike to the summit. But how many more? A 10% increase? 25%? 50%?
In the future, their count data can answer this important question for them. Read about more ways Acadia National Park uses their count data here.
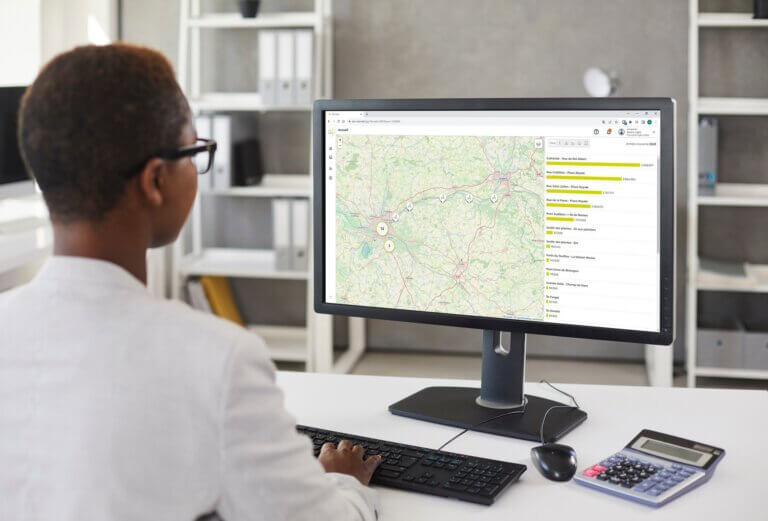
Measuring and anticipating site saturation at Parc Miribel Jonage, France
At France’s Parc Miribel Jonage, park managers have also equipped themselves with pedestrian, bicycle, and car counters to enhance the park’s visitor experience.
This 5400-acre park is located between the south of the department of Ain and the Lyon conurbation. It is both a leisure and recreation area, as well as a drinking water reserve for 95% of the Lyon region. It is also a site of exceptional natural heritage and is classified as a Natura 2000 site.
The visitor data they collected allowed them to determine the number of cars present on site and to establish different thresholds: regular parking, illegal parking, and site saturation.
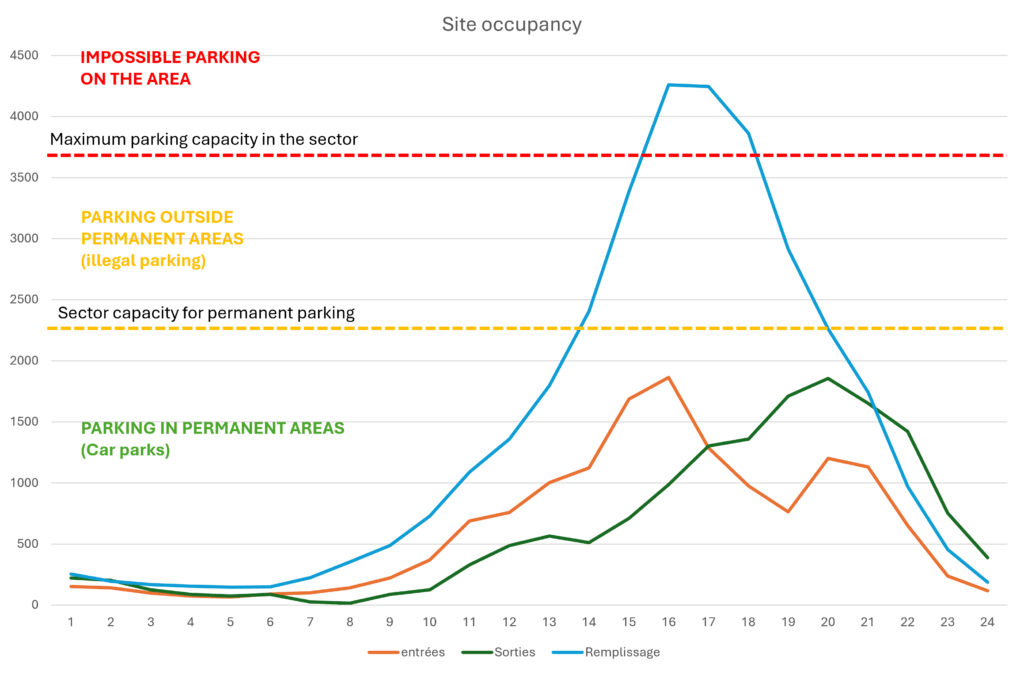
Hourly traffic profile and site saturation thresholds examples, credit Christophe Jarraud, Segapal
Site saturation is problematic, even more so because it restricts busses from accessing the park. With a view of reducing environmental impact, it is vital to encourage access via public transport. The data collected is used to support the actions and policies to be implemented to prevent this phenomenon from occurring.
Among the measures taken: the introduction of an express bus service to the park, which reduced journey times by a factor of three compared with a conventional bus service (and encouraged modal shift). As well, the construction of 47 miles (75km) of bike paths has also helped to reduce the use of private cars to get to the park.
Analysis of visitor data also revealed that 50% of visits were via the historic entrance to the site, compared to 16-20% via the Machet entrance. The aim is to rebalance visits between the historic entrances and the new ones, in order to reduce shearing and overall congestion on the site. Communication and signage work has been undertaken to better direct visitors to the Machet entrance, and counts are being taken to measure the impact of these measures.
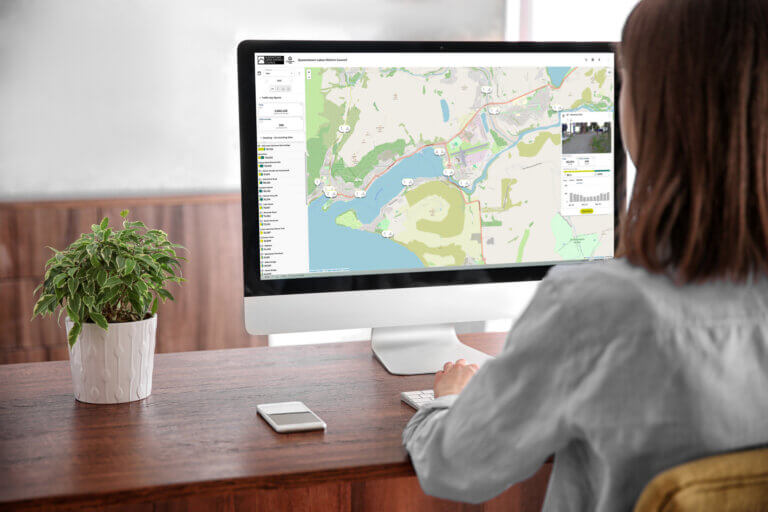
Developing and adapting resources at Mount Royal Park, Canada
Mount Royal Park is one of Montreal’s most important green spaces. Designed by Frederic Law Olmsted and inaugurated in 1876, it is the centerpiece of the Mount Royal heritage site, the oldest municipally protected area in Quebec.
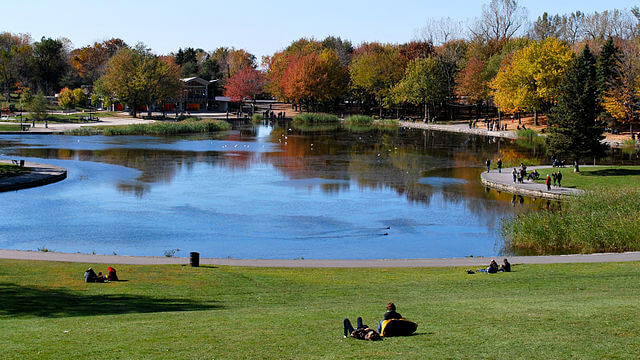
Mount Royal Park (Beaver Lake)
To work on issues of accessibility, conservation, heritage enhancement, management, and planning, the park has equipped itself with 22 counting systems. This includes permanent pedestrian counters (PYRO Boxes) and temporary bicycle counters to monitor visitor numbers in Mont Royal Park, Jeanne Mance Park, and Tiohtia:ké Otsira’kehné Park, the three main parks on the heritage site. According to the city of Montreal:
“The data is a real decision-making tool. They enable us to plan better development projects, adapted to the observed traffic. They provide a better understanding of the distribution of visitor numbers, and enable us to better plan the resources required to support the services offered in the park.”
Some examples of use:
- Attendance data is used to measure winter ski and snowshoe trail use.
- The data can be used to validate the need for more sustainable development of secondary trail sections in wooded areas and to justify planned interventions to advisory and decision-making bodies.
- The data also allowed them to determine the volume of bicycle traffic and to better understand potential conflicts of use.
- Finally, thanks to the integration of GPS data, the data will make it possible to quantify illegal sporting practices in natural environments (mountain biking and off-trail racing bikes) that damage flora and fauna.
Traffic figures and trends
In 2006, studies estimated the number of visitors to Mount Royal Park at 4.5M (and 2.5M for Jeanne Mance Park).
In 2024, the volume of visitors to Mount Royal Park will be at least 4.8M, a figure that is still subject to change as it only takes into account around 80% of the sites (see “Observation history” section).
Since the installation of the counters, an increase in visitor numbers of 6.6% between 2022 and 2023 has been observed. To date and over a comparable period, the increase is 8.8% between 2023 and 2024.
An upward trend is therefore taking hold, likely driven by changes in habits linked to the pandemic, the overall increase in Montreal’s population, and perhaps a new tendency to take advantage of urban parks rather than going out of town.
Conclusion
In short, data informs decision-making, enabling us to justify developments and implement all kinds of measures to improve the visitor experience. This includes implementing vehicle parking reservations, measuring visitor saturation in different areas, and following visitation trends for more extensive redevelopment projects. Factual data is all the more important when measures are put in place that restrict visitor access. Without reliable, ground-truth data, it is much more difficult to justify the actions.