


With a modal share of just 4% compared to the global average of 22%, North Americans are not particularly in love with walking as a mode of transport. This makes sense, as we are among the most car dependent countries in the world. In fact, for every 1000 inhabitants, Americans own 860 cars (#2 out of 64 countries) and Canadians own 707 (#6 out of 64 countries).
That said, this doesn’t mean that we are against the idea of walking more. In fact, the majority of Americans support the idea of a 15-minute city, or a city where citizens can reach all the key amenities they need with a 15 minute walk or transit. Plus, according to the latest NAR Community and Transportation Preferences Survey, 85% of Americans said sidewalks and places to walk are very/somewhat important when deciding on a place to live, and 78% indicated that they would be willing to pay more to live in a walkable community.
So, what gives?
In short, it boils down to “walkability”. Which begs the question: What is walkability and how do you improve it?

What is walkability?
Walkability refers to how accessible services and amenities are in an area by foot. To gauge this, a reasonable walking distance, usually around 30 minutes, is used as a benchmark. This concept evaluates how pedestrian friendly an area is in terms of safety, accessibility, convenience, interconnectedness, and attractiveness.
Real walkability comes with quality infrastructures, safe intersections, and a focus on making facilities accessible to people in all communities and people with reduced mobility. It also relies on a specific focus on active modes over motorized modes to inspire more use of the former over the latter. This idea is excellently expressed in the “mobility pyramid” drawn by Danish architecture firm JAJA, inspired by the food pyramid:

(Image credit: JAJA)
What are challenges when it comes to walkability?
In the United States, one of the greatest challenges to walkability is safety. Over 7500 pedestrians were killed in motor vehicle crashes in 2022, representing a much higher fatality rate per distance walked than similar countries, even though Americans walked less. Additionally, America was the only country with increasing pedestrian fatality rates over a 10-year span in a study done by Rutgers University. Other countries in the study included Canada, France, the United Kingdom, and Germany. Vehicle traffic was also large barrier to safe walking according to almost 25% of Americans, with speeds being a primary concern.
Another barrier to walkability is a lack of infrastructure such as sidewalks, safe crossings, and pedestrian signals. Finally, although there are many other factors, another barrier is an overall less favorable view of walking compared to driving.
An important point to note is that urban sprawl is often referenced a primary barrier to walkable cities. However, this isn’t entirely the case, as in most cases it comes down to a lack of access and other factors rather than overwhelming distances.
What are the benefits of walkability?
Among the multitude of benefits of a walkable city, here are three:
- Walkability is good for the economy: Walkable areas tend to support local business, promote tourism, and raise property values. In fact, highly walkable zones in the largest 35 metropolitan areas in the US are associated with a disproportionately high level of GDP generation.
- Walkability is good for public health: Walking 30 minutes per day for five days a week is linked with improved cognition and memory, weight loss, a reduction in an individual’s risk of death by 20% to 50%.
- Walkability is good for equity: In 2022, low-income households spent about 30% of their after-tax income on their transportation. More walkable cities support low-income communities and create more transportation options, creating net benefits for the citizens who need it most.
How do you measure the walkability of a city?
There is no “one size fits all” approach to measuring the walkability of a city. How walkable your city is will depend on your situation and how you define your benchmarks. However, a solid strategy is to use indicators based on reliable, concrete data.
Indicators
Several types of indicators can be used to evaluate walkability. To simplify, you can categorize them into quantitative and qualitative indicators.
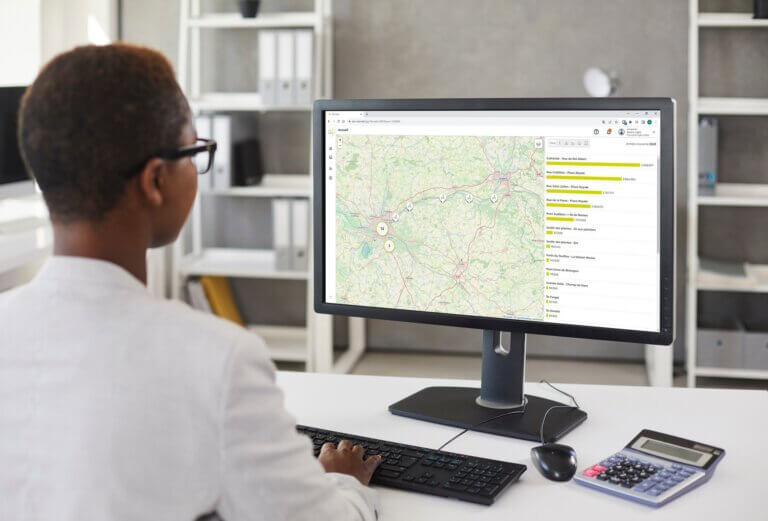
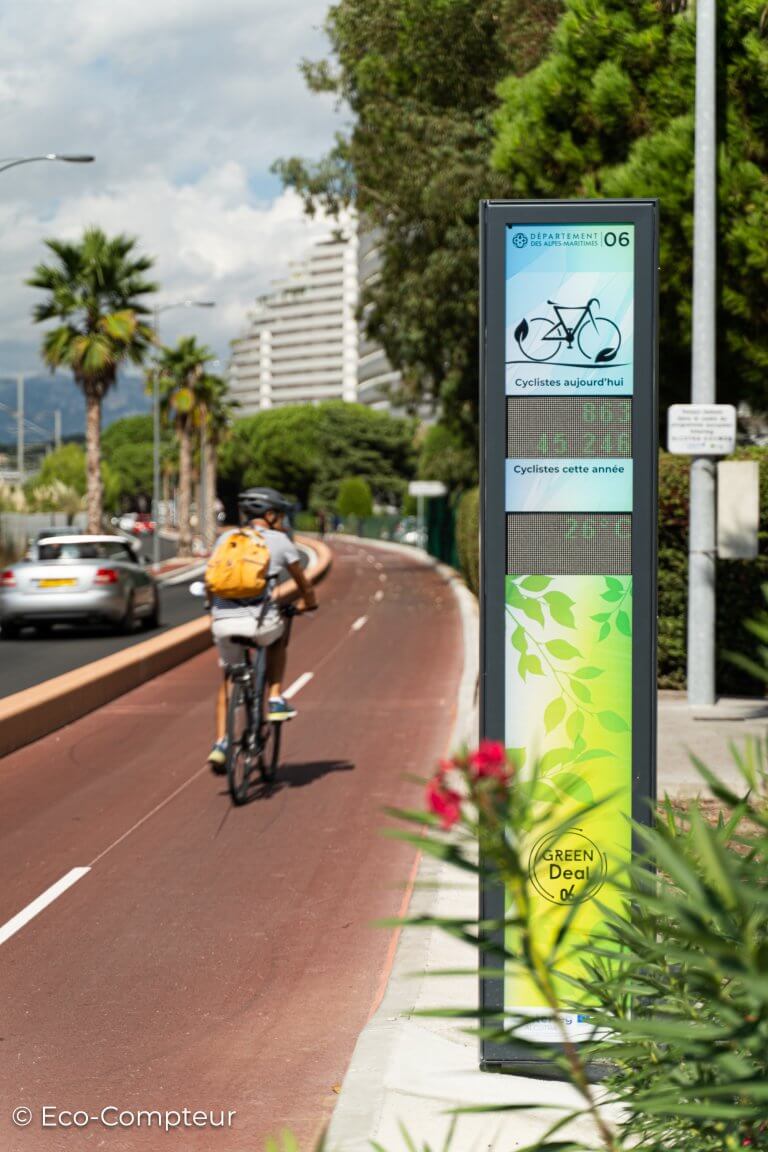
Quantitative indicators include: total pedestrian traffic, long-term volume trends, average journey time, average distance travelled, and average vehicle speed. You can also compare different areas using standardized indicators such as Average Annual Daily Traffic (AADT).

Example of changes in pedestrian counts between 2023 and 2024 near a secondary school in an urban environment. An increase in pedestrian traffic can be observed in the last quarter of 2024.
Another quantitative indicator is the WalkScore, which provides a quick measure of a location’s walkability, based on an algorithm that factors in the availability of amenities within walking distance.
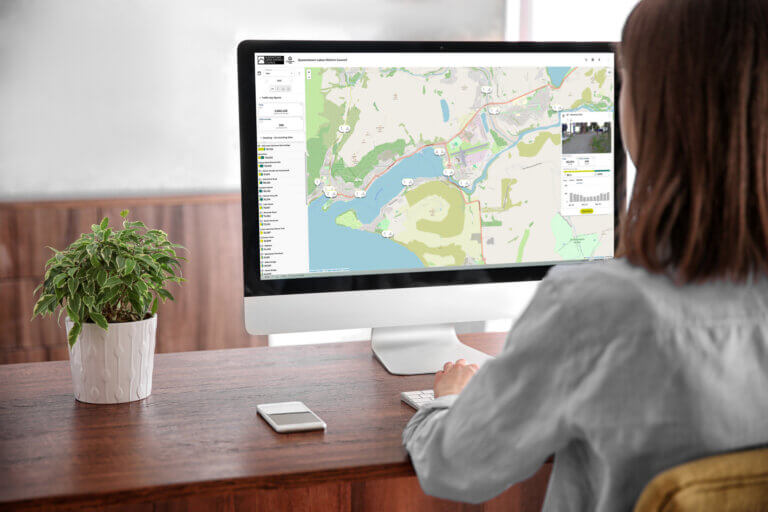
On the other hand, qualitative information can also be essential when determining the walkability of an area. Even if they are more subjective, actionable changes often emerge when this type of data is collected (e.g. pavement condition, accessibility, visual appeal, etc.).
Developed by the international charity Walk21, the Walkability app lets citizens share their feelings about walkability in their area, providing valuable qualitative information. For example, people can comment on how safe they feel walking down certain sidewalks, whether a street looks inviting to walk on, where they wish sidewalks existed, and even take geotagged photos.
To find out more about the application: https://walk21.com/resources/walkability-app/.

(Image credit: Walk21)

How to obtain quantitative and qualitative indicators: data sources and data fusion
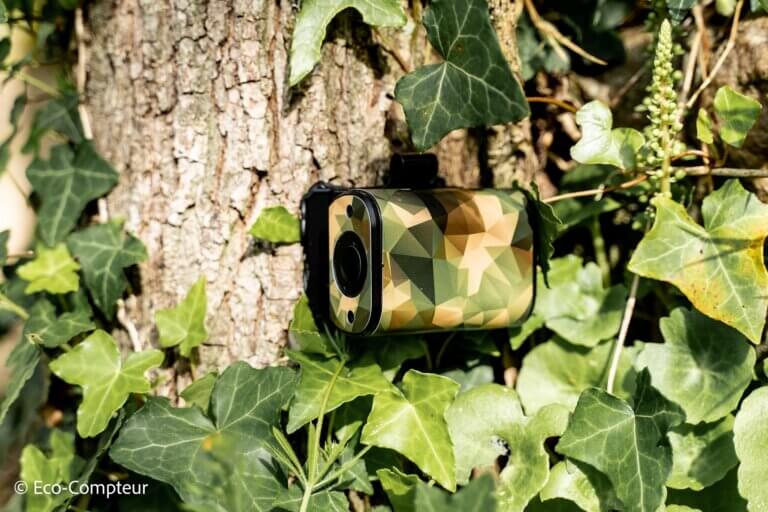
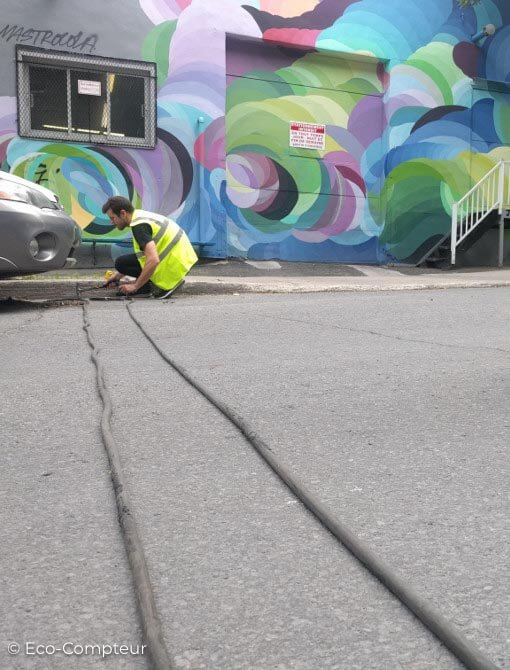
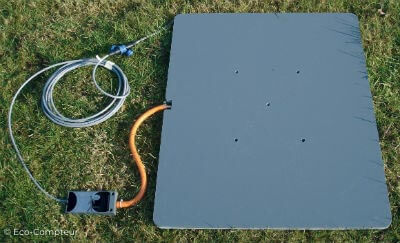
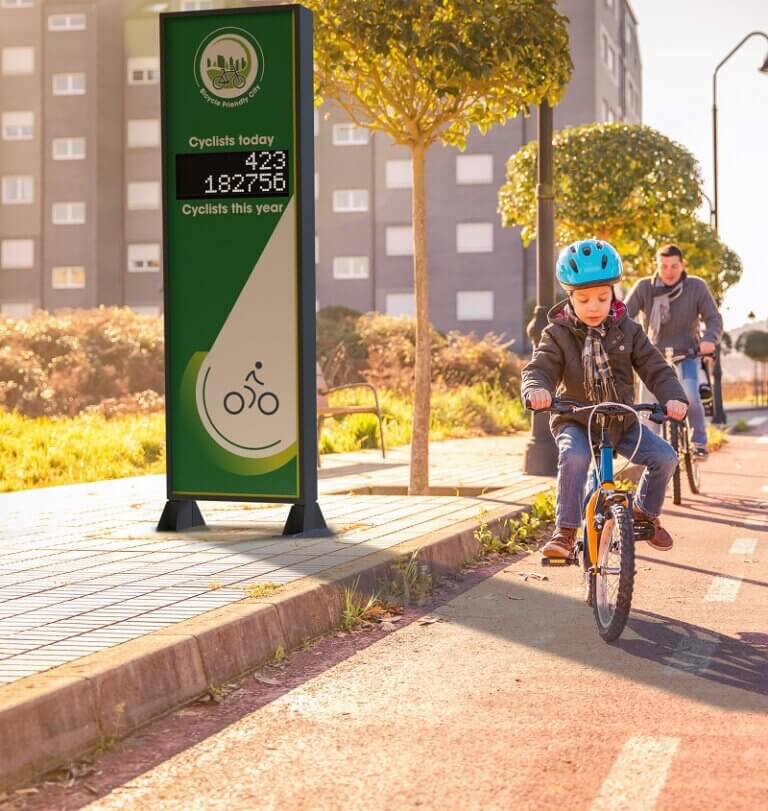
At Eco-Counter, our opinion has always been the same: to obtain great indicators, ground-truth data is essential. Our automatic counters, that can count multiple types, 365 days a year, are able to provide this.
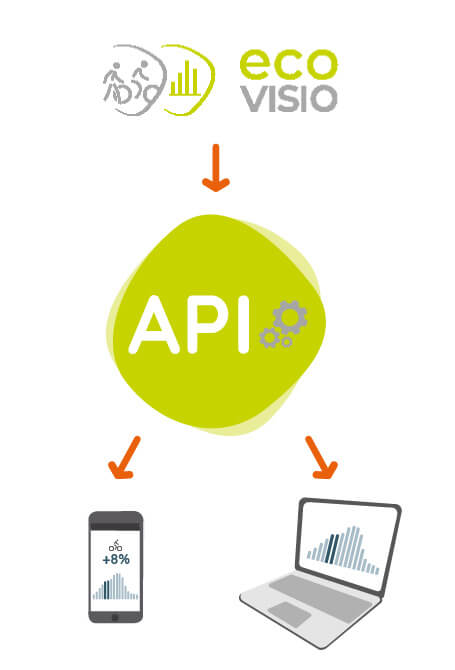
That said, it is possible to do any even deeper analysis of an urban area. You can enrich count and speed data from counters with data from GPS traces, mobile apps, and cellular networks though data fusion. This functionality is the basis of our VisitorFlow solution.
With data fusion, cities can draw up walkability development plans, measure successes (increase in average distance walked, increase in pedestrian traffic), or identify obstacles (weather factors contributing most to the decline in walking, high-risk intersections).
Between July 2023 and January 2024, we carried out a study of this nature in Paris, France.
Walkability case study: Robespierre metro station in Paris, France
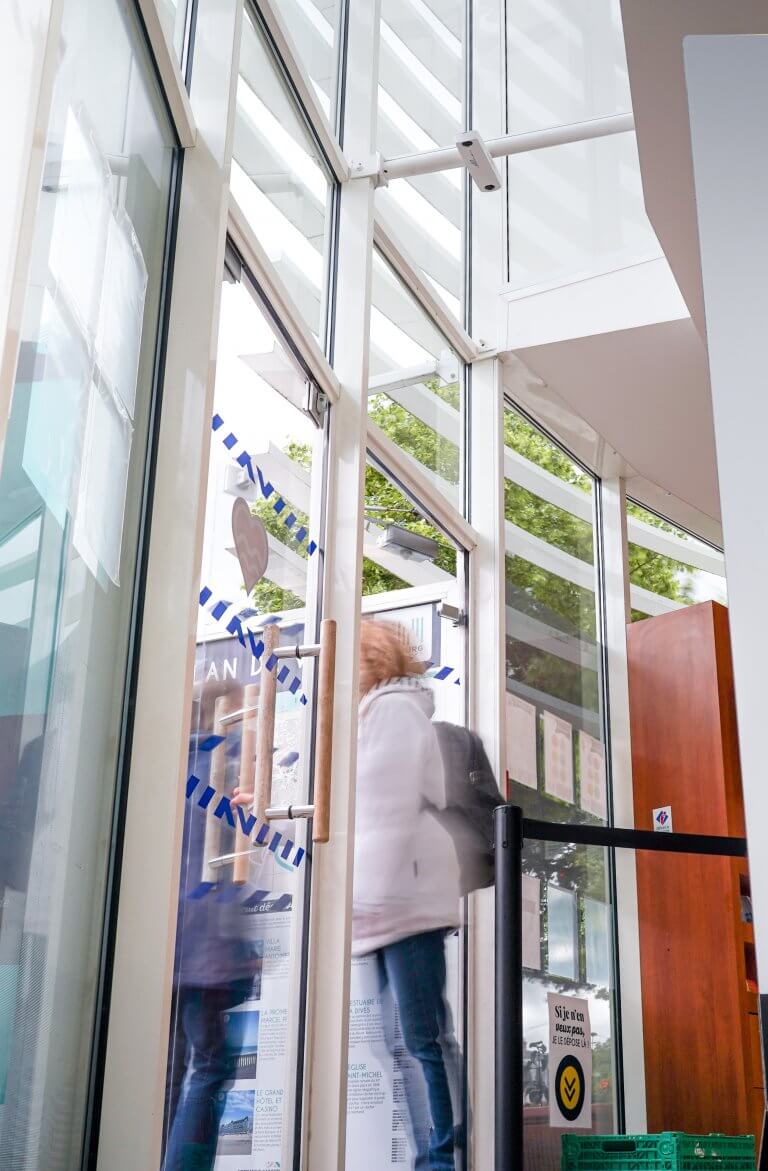
In this study, carried out between July 2023 and January 2024, we analyzed pedestrian traffic around the Robespierre metro station in Montreuil, a commune in the east of Paris, France. Our methodology combined automatic count data (collected with our CITIX-AI camera counter, which used AI to count and classify several user types) and GPS data from cellular devices. Count data was used to adjust estimates of pedestrian flows based on GPS data, thus reinforcing the reliability of the results.
This cross-referencing of GPS data and automatic counts was a robust approach that also respected the European General Data Protection Regulation (GDPR).
Results:
- Count Volumes: Over 2.4 million counts were recorded over the period, with a daily peak of 30,944 visitors on December 1. Average daily traffic was 12,865. The majority of traffic flows were concentrated on working days.
- Trip characteristics:
- The average distance covered by pedestrians was 559 meters (0.35 miles), with a median of 394 meters (0.24 miles).
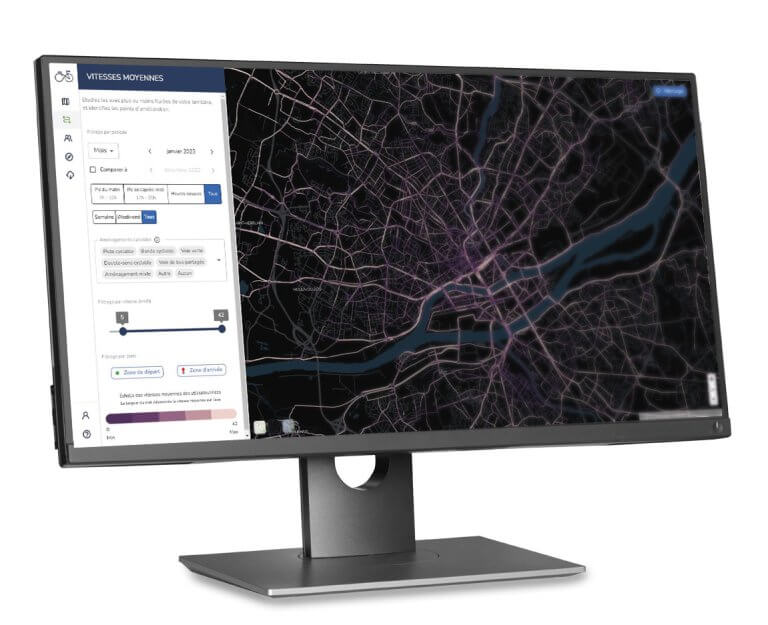
- The average walking speed was 3 km/h (1.86mph), with variations according to day of week and time of day.
- Pedestrian origins and destinations:
- Some 73% of pedestrians lived or commuted within 10 minutes of the station, underlining local and proximity use.
- Trips were strongly influenced by proximity to facilities and amenities of interest (offices, supermarkets).
The results highlight the importance of short trips in dense urban environments, and reinforce the metro’s role as a center of attraction for a large portion of local journeys. They can be used to guide urban redevelopment projects to maximize accessibility and improve neighborhood walkability.

Conclusion
As we have seen, improving walkability is a worthwhile project, requiring a comprehensive approach combining data collection, data fusion, and ongoing monitoring of the decisions taken. Here are the key points to bear in mind:
- Walkability refers to how safe, accessible, convenient, interconnected, and attractive an area is for walking.
- Walkability depends on quality infrastructure, safe intersections, and accessibility for all.
- Although walking is not as popular as it should be in the U.S., people recognize the importance and value of pedestrian infrastructure and walkability
- Challenges to walkability in the U.S. include safety concerns, lack of infrastructure, and public opinion of walking.
- A more walkable city is good for the economy, public health, and equity.
- Walkability can be assessed using both quantitative and qualitative data. For example, a combination of automatic counting data and GPS tracks can provide valuable information on walking habits, as in the example presented above.