BACKGROUND
As the capital of Canada, Ottawa is more than just the base of operations for Parliament; it’s a dynamic city that blends culture, history, and a superb mix of urban and green spaces.
Nestled on the banks of the Ottawa River, the city boasts an extensive network of streets, parkways, and multi-use paths. Home to over a million residents, Ottawa is a haven for active transportation users; pedestrians, cyclists, scooters, rollerbladers, you name it. That said, it faces the same urban mobility challenges as many other large cities, such as congestion, resource allocation, and safety concerns for non-motorized road users.
OTTAWA’S COUNT PROGRAM
Ottawa is constantly making strides to reshape the city’s transportation framework to accommodate an increasing number of pedestrians, cyclists, and other road users. With these efforts comes data monitoring through a count program.
The city of Ottawa is no stranger to counting. In the last 15 years, they’ve had around 300 active sites where they’ve collected data either permanently or temporarily. Today, their fleet stands strong at 35 counters. Though this may seem like a lot, with the size of their city, this gives them just enough distribution to cover key downtown and urban areas. This year, their count program clocked over 8 million counts—and the year isn’t even over yet!
WHAT THEY DO WITH THEIR DATA
As is the case for many cities, Ottawa’s counters were installed as part of capital projects that involved infrastructure changes or improvements. These counters justify policy decisions, reveal daily to yearly trends, and inform the city on how average daily counts are changing every month.
That said, every counter tells a story, and the nation’s capital has been very effective in the use of their count data. Their data applications are diverse and provide great examples of what to do with counters in your city or community!
Justifying the Renewal of a Pedestrian Bridge
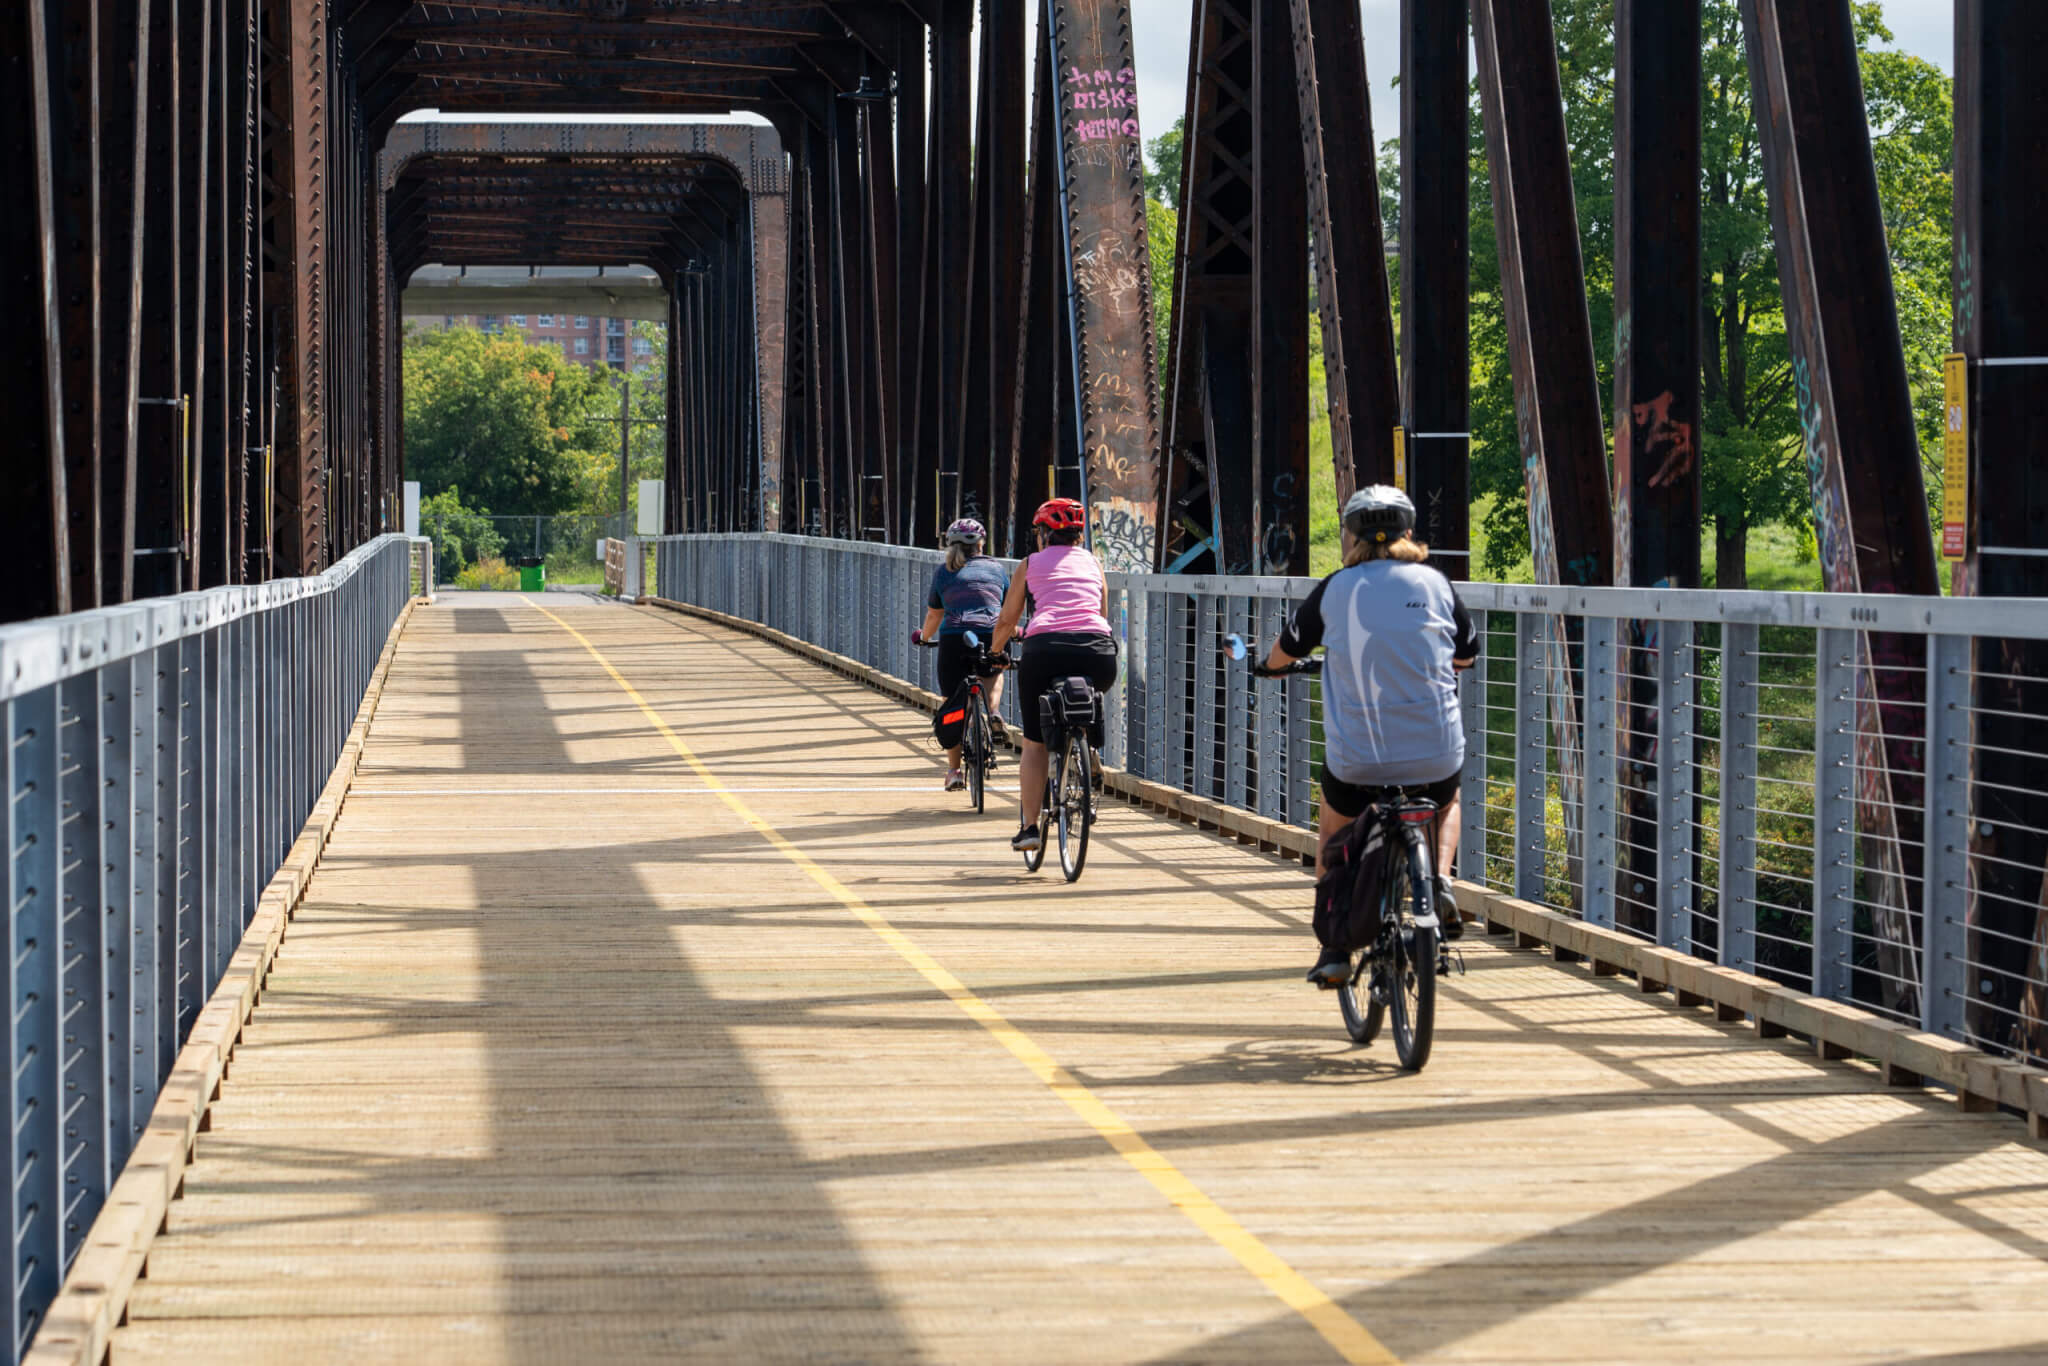
The Chief William Commanda Bridge, formerly the Prince of Wales Bridge, was constructed in 1879 as a railway link and purchased by the City of Ottawa in 2005. Several years later, the City of Ottawa launched a project to turn this unused rail bridge over the Ottawa River into a multi-use pathway connecting Ottawa and Gatineau, Quebec.
Starting in July 2021, the construction went on until the bridge finally opened to the public in November 2023. In the end, the bridge cost $23.9 million. But did people use it?

The Chief William Commanda Bridge. Photo: City of Ottawa / Ville d’Ottawa
Equipped with an automated counter, the City of Ottawa collected quantitative data to justify the investment. On the first day, they got over 8000 counts. In the first week, almost 30,000 crossings. Today, their multi-modal counter reveals that the bridge gets an average of 1500 counts daily, with a running count of over 500,000 this year. Also, they know that about 60% of the people crossing are cyclists and 40% are pedestrians, which could inform future speed signs or safety measures.


Key figures and distribution of pedestrians and cyclists on the Chief William Commanda Bridge in 2024.
Another interesting point for the future of counting on this bridge: for the second winter in a row, the bridge is closing because it was not designed for safe snow removal operations. However, the public has expressed a desire for the bridge to stay open. If they decide to adapt the bridge for the winter, the City of Ottawa’s counter will be there to monitor the results of their work.
Understanding the City’s Downtown Transportation Trends
The COVID-19 pandemic slowed active transportation to a halt in the City of Ottawa, as it did all around the world. However, Ottawa noticed an interesting trend in the following years as people began travelling in the city’s downtown again.
In general, the volume of pedestrians and cyclists returned to pre-pandemic levels. However, they saw that the central part of downtown bounced back gradually, whereas the outer core shot quickly and drastically past 2020 volumes.

Two sites in central downtown with gradual increases in bike volumes from 2020-2024.

Two sites in outer downtown with drastic increases in bike volumes from 2020-2024.
This finding was only possible thanks to years of consistent data collection. Now, the city can say with confidence that downtown active transportation facilities are generally being used more than five years ago. Plus, they also learned that facilities in the outer core of downtown are rapidly getting more popular, possibly requiring more resources in the future.
Correlating Weather and Cycling Behavior in Downtown
One thing to know about Ottawa is that the winters get chilly. It’s common for temperatures to fall below –10 °C (14 °F) in the colder months of the year. Additionally, snowfall can average over 30 cm (1 ft) per month in the peak of winter.
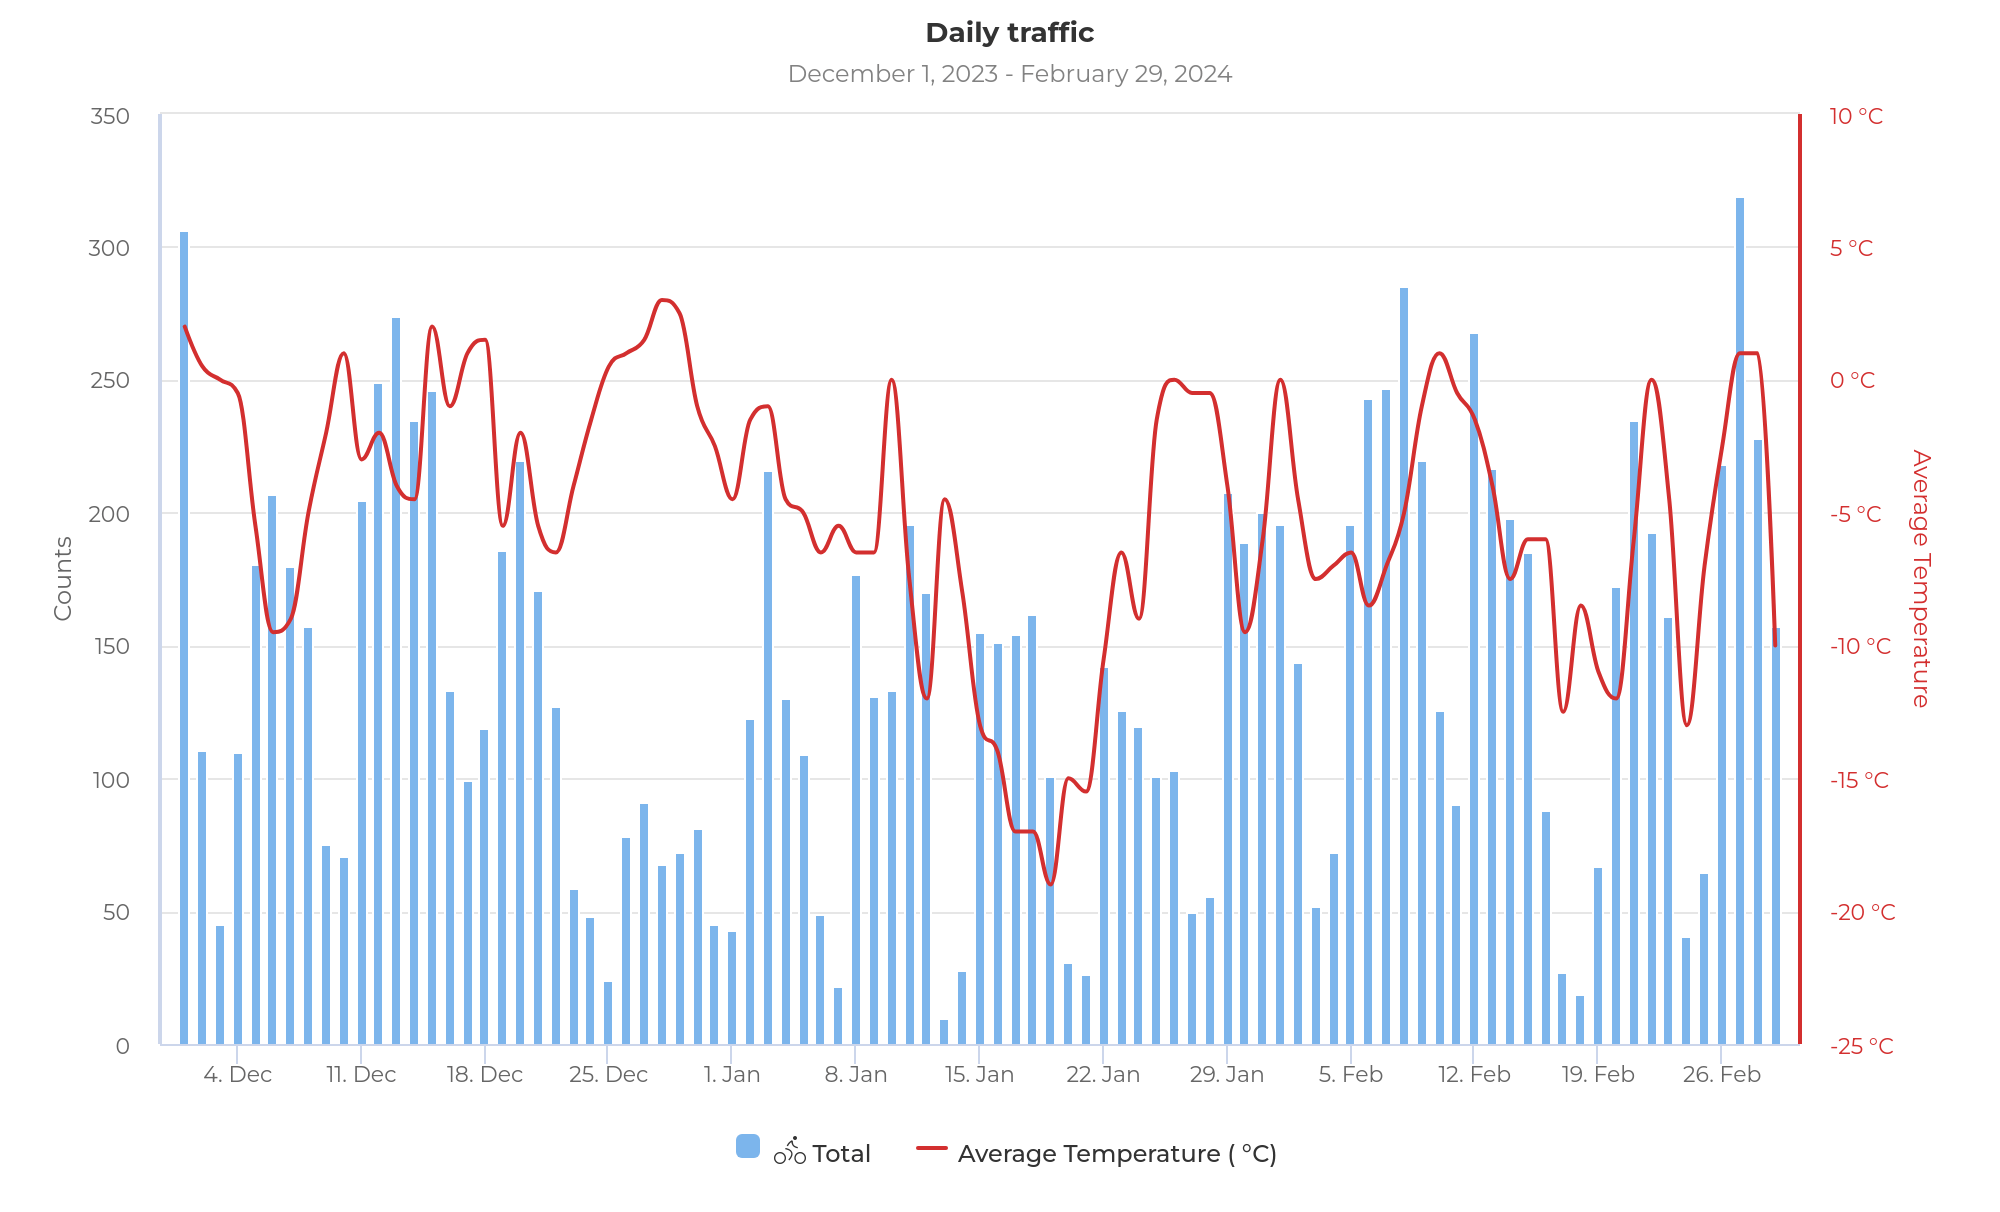
Eco-Counter studied Ottawa’s bike volumes during the winter and found that, below -8 °C (18 °F), cycling volumes were generally unaffected by cold and snow on winter-maintained facilities. In fact, 60% of cyclists rode during the coldest day of winter, where the average temperature was –20 °C (–4 °F).
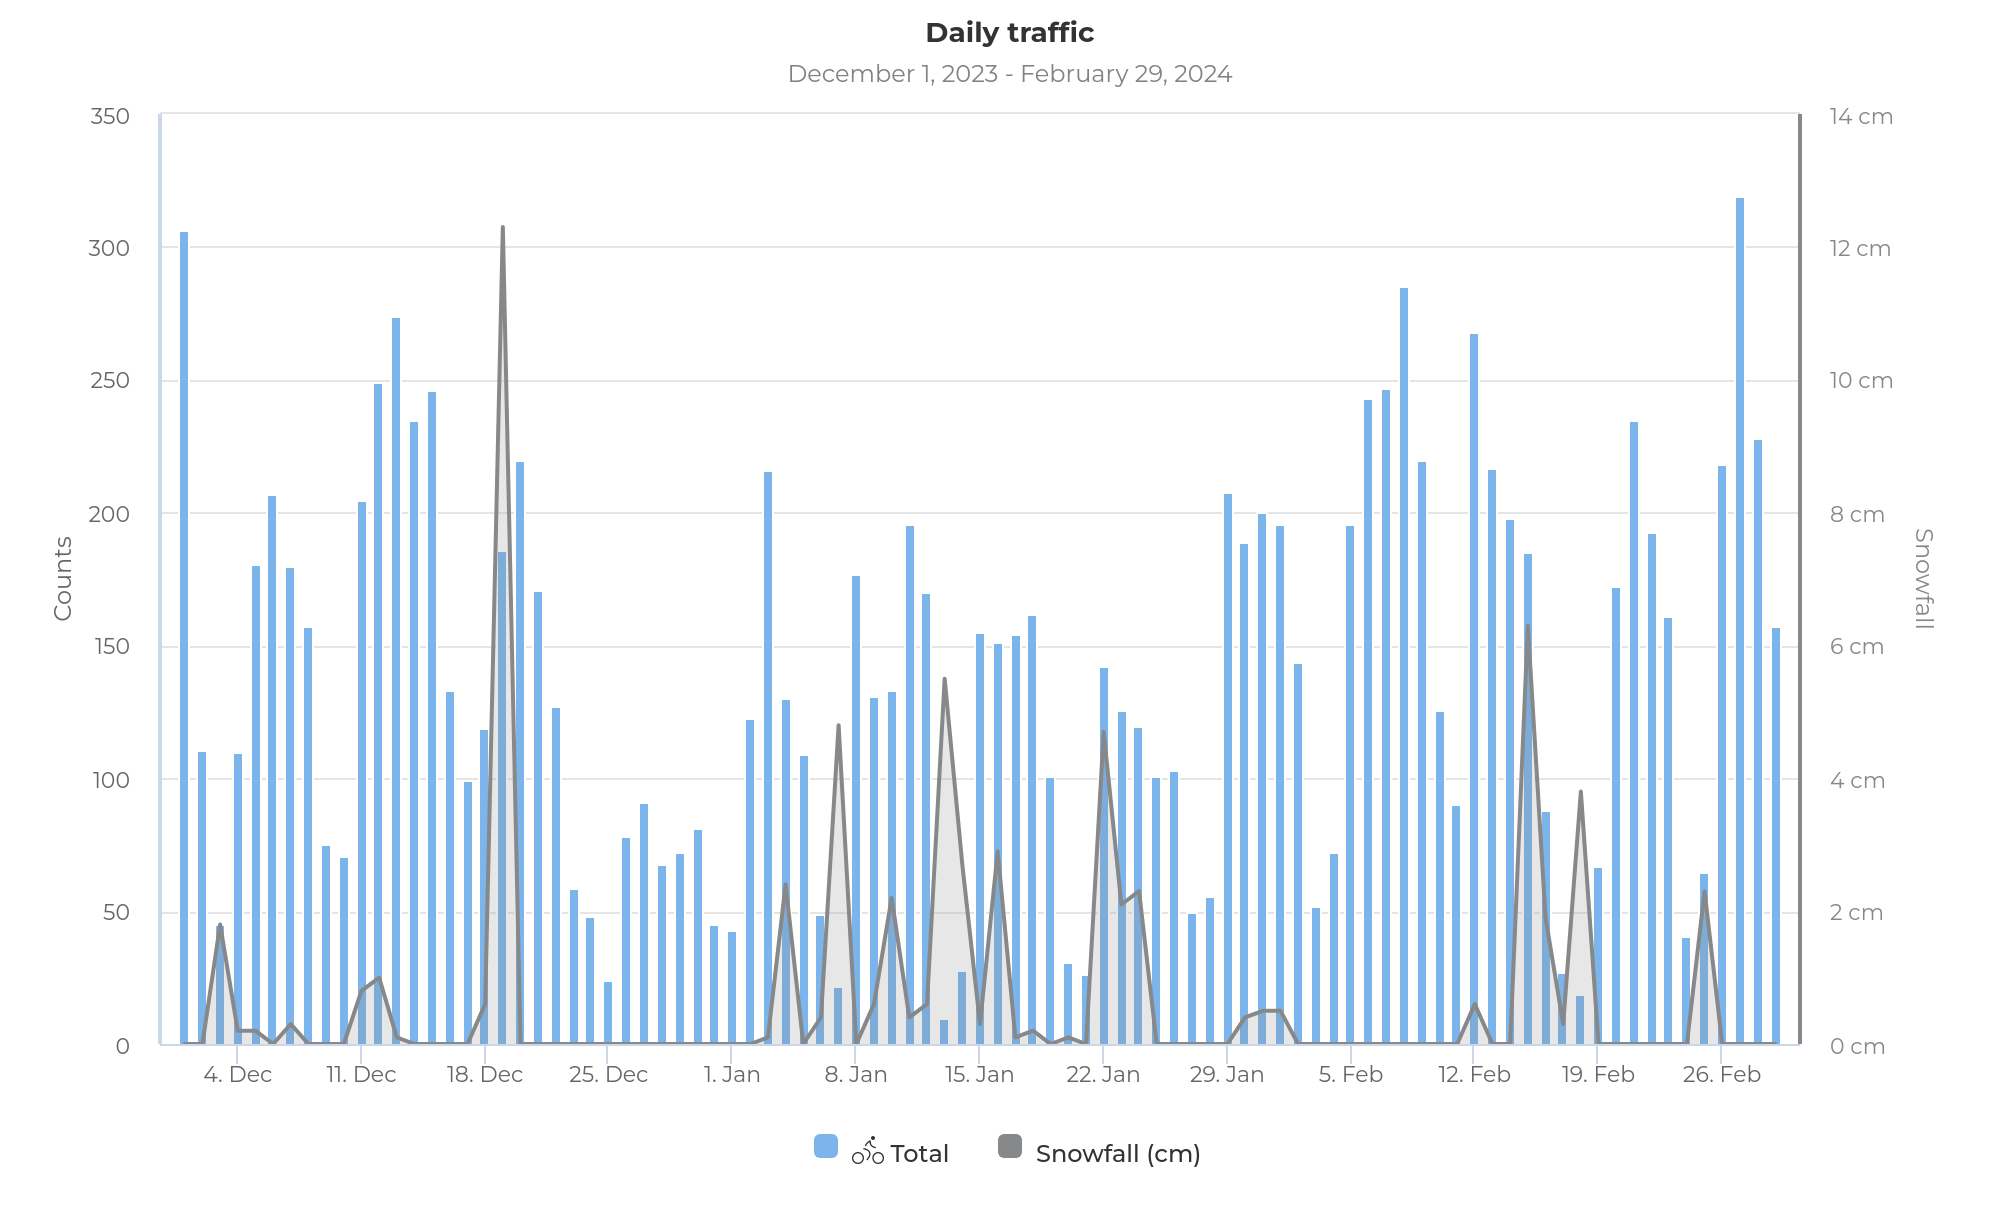
Looking at data from this year, this trend is still present. Using their weather analysis module for a central downtown bike lane, it’s evident that cycling volumes aren’t strongly correlated with temperature or snow.

Daily bike counts and average temperature from the winter of 2023-2024 on Laurier @ Metcalfe.

Daily bike counts and snowfall from the winter of 2023-2024 on Laurier @ Metcalfe.
This data has made one thing clear for Ottawa – their snow removal efforts are paying off, since their citizens don’t stop biking!
Assessing the Optimal Detour During Construction
A final clever use of the City of Ottawa’s count data: planning detours for cyclists.
When a shared facility undergoes construction, the city must decide the best way to divert bicycle traffic. Is it enough to repurpose a portion of the sidewalk and divert traffic through there? When the facility averages a low daily volume, yes. But at high daily volumes, there is a need to mitigate conflicts between pedestrians and cyclists by providing more space or alternative facilities.
Because of their counter coverage on the cycling network downtown, Ottawa has data at its fingertips to help inform various detour plans.
Read more about Ottawa’s the multi-modal counters.
Interested in their data analysis platform? Learn about Eco-Visio.


