How data keeps cyclists safe
Data is an essential tool for encouraging and developing cycling, and we’ve been working with this in mind for over 20 years. Counting, which can be combined with qualitative data, provides vital information for decision-making. An example of this is our Cycling Insights solution, which has proved its value in planning, managing, and communicating about cycling.
Cycling Safety: Leveraging Data to Support Vision Zero
As cities across the world adopt Vision Zero—a strategy aimed at eliminating all traffic-related fatalities and serious injuries—cycling safety has become a pressing issue. Despite meaningful advancements in reducing overall traffic fatalities, the trend for cycling safety has been less encouraging.
According to the National Highway Traffic Safety Administration (NHTSA), the U.S. saw an increase of 9% in cyclist fatalities between 2019 and 2022. This is more eye-opening when set against the stability of bicycle traffic in the US as shown in our Eco-Counter Index analysis. This suggests that even though cycling volumes aren’t increasing, cyclist fatalities are. On the same note, Canada showed a +3% increase in bicycle traffic for the same period and a 7% increase of cyclists’ fatalities between 2019 and 2022.
This disconnect—stable or minimal growth in cycling paired with increased cyclist fatalities—suggests that cycling conditions may be worsening for North American cyclists. This contrasts with trends seen in places like France, where infrastructure investments and national policies have helped improve cyclist safety despite increasing cyclist numbers. This trend in North America underscores the urgency of using data to understand the specific factors contributing to this risk.
The Role of Data in Building Safer Cycling Networks
In major cities such as Vancouver, New York, and Chicago, cycling infrastructure and data-driven safety interventions are critical components of Vision Zero efforts. These cities are using detailed data on cycling volumes, reported “hot spots” of perceived danger, and collision locations to prioritize investments in safe cycling infrastructure. For instance, the City of Vancouver is focusing on high-risk intersections where collision data and usage data reveal the need for targeted improvements.
Risk exposure for cyclists: a Vancouver study
On behalf of the City of Vancouver, Eco-Counter analyzed cyclist count and crash data between 2010 and 2020 to identify periods and locations with high collision risk in the area.
The study revealed that collision risk is highest in late fall and early winter, with high-risk intersections on major arterial roads without protected bike lanes. The data also showed that the most dangerous locations in absolute terms (number of accidents recorded) are very different from the most dangerous locations in terms of collision rate (number of accidents recorded/frequency of use). In fact, the most accident-prone intersections are more likely to be found on the city’s outskirts.


Going further: analyzing near-misses and conflicts of use
That covers the “visible” part of the iceberg, but what about conflicts of use, smaller incidents, or “near misses”? These events are generally not documented in a systematic way, even though they reveal areas of risk, which are essential for planning safe cycling facilities and can also discourage cyclists, hindering the development of cycling as a practice.
Unlike accidents recorded by the police, conflicts of use and near-accidents require specific methods to be detected.
An example of how Cycling Insights is used
One of the methods used to identify the most accident-prone junctions is Cycling Insights, which combines count data with qualitative information provided by GPS tracks, in particular Geovelo.
This cross-referencing makes it easy to identify accident-prone areas in relation to traffic measured on site, using information collected by cyclists on their journeys (sudden braking and stopping times in particular).

Example of sudden braking visualization to identify potential accident-prone junctions
Conflicts of use
Other useful data for this kind of analysis include information on speeding and contra-flow traffic, which can be used to understand usage patterns and limit the risk of accidents. For example, in Grenoble, France, data collected by the ZELT Evo bike & scooter counter showed that 25% of scooters do not comply with regulations limiting the maximum speed to 25 km/h (15 mi/h).
The direction information collected by the ZELT Evo also enabled us to understand and anticipate conflicts of use.
Specifically, on the same site, which has a one-way cycle path on both sides of the road, we observed that 3% of users use the track against the flow of traffic in the direction of the downtown, but that this figure rises to 5% for the other direction!

Analysis of near-misses in Rennes and Rouen, France
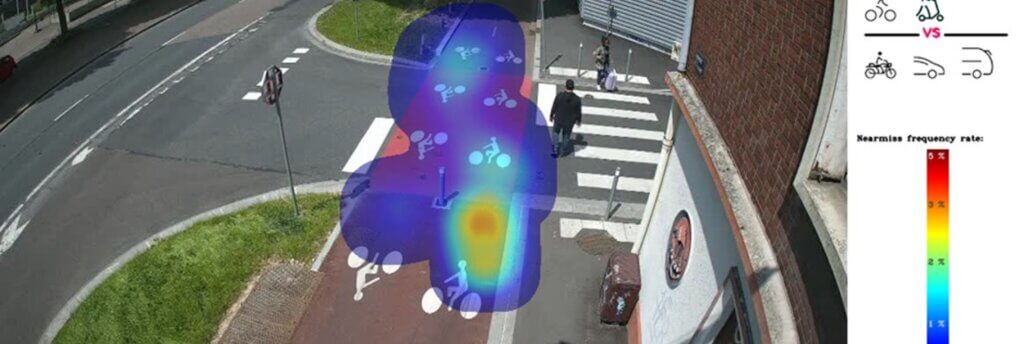
To take things a step further, Eco-Counter carried out detailed studies on intersections in two French cities, Rennes and Rouen. Thanks to a camera-based counter incorporating artificial intelligence (CITIX-AI Evo), the data collected let us identify four levels of near misses, ranging from a simple disturbance to a dangerous situation.
In Rennes, one site was studied. Out of 4925 passings recorded, only 14 near-miss situations were identified, with a low level of severity, which led to the temporary road design being made permanent.
In Rouen, four sites were studied using the same system. The data showed that two of the four sites had a conflict rate of less than 0.1% of traffic, while the other two had a conflict rate of around 0.2%. This difference provided insights for future redesigns.

Example of near-miss analysis with heat map. Stopping vehicles on a cycle path crossing creates an unsafe zone for cyclists
Conclusion: design facilities that make cyclists truly safe, using data
In-depth analysis of accident and near-miss data plays a major role in understanding cycling usage and designing safe facilities for all. This comprehensive approach enables us to:
- Identify areas of real and perceived risk
- Anticipate potential dangers before they materialize
- Adapt infrastructures to the specific needs of cyclists
- Encourage cycling by reinforcing the feeling of safety.
By combining these different sources of data, local authorities can make informed decisions to create a safer and more attractive cycling networks.


